


Introduction to Liver MRI for Surgeons
- Diagnosis of Metastatic Liver Cancer -
MRI findings for metastatic liver cancer and liver tumors that require careful differentiation (1)
Metastatic liver cancer
Images provided by: Hamamatsu University School of Medicine
Metastatic liver cancer typically appears as a ring-shaped enhancement during the hepatic arterial phase of dynamic contrast-enhanced imaging (Fig. 19). Because lesions normally contain substantial fibrous stroma, enhancement inside the lesions during the portal venous phase and transitional phase is often very faint and slightly prolonged though the entire lesion shows hypointense.
EOB-MRI has an extremely high detectability for metastatic liver cancer. A meta-analysis regarding the detection of colorectal liver metastasis reported 93% sensitivity and 87% specificity for EOB-MRI compared to 82% and 74% for contrast-enhanced CT and 74% and 94% for FDG-PET, demonstrating the superiority of EOB-MRI12). In colorectal cancer, resection of metastatic liver cancer is expected to improve patients' outcomes, hence liver resection is often considered for metastatic lesions. Even in such cases, it is reported that treatment strategy for colorectal liver metastases was altered in 19–37% of cases when adding EOB-MRI to routine contrast-enhanced CT13–15).
Pancreatic cancer is recognized as unresectable when liver metastases are detected, hence the detection of liver metastasis plays an extremely important role in determining whether a patient is indicated for resection of the primary lesion. The sensitivity for the detection pancreatic liver metastasis in EOB-MRI (Fig. 20) is reported as 82% by patient and 93% by lesion, which is clearly superior to that of contrast-enhanced CT (60% by patient and 75% by lesion)16) and also higher than that of contrast-enhanced MRI with an extracellular gadolinium-based contrast agent (95% vs. 84% sensitivity)17).
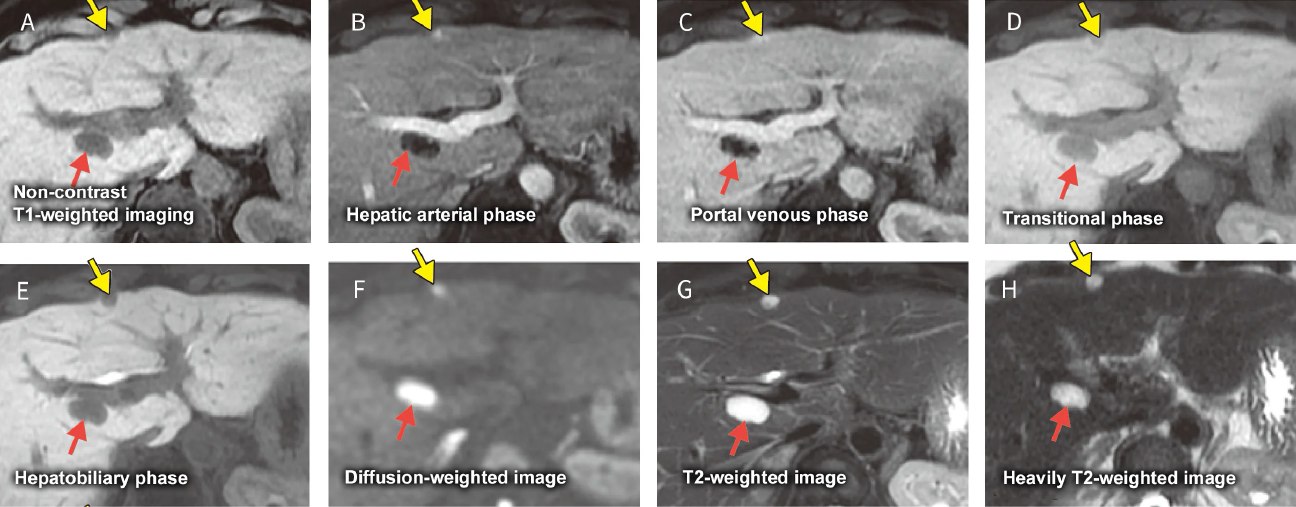
Fig. 19 Male in his 50s with metastatic liver cancer from sigmoid cancer
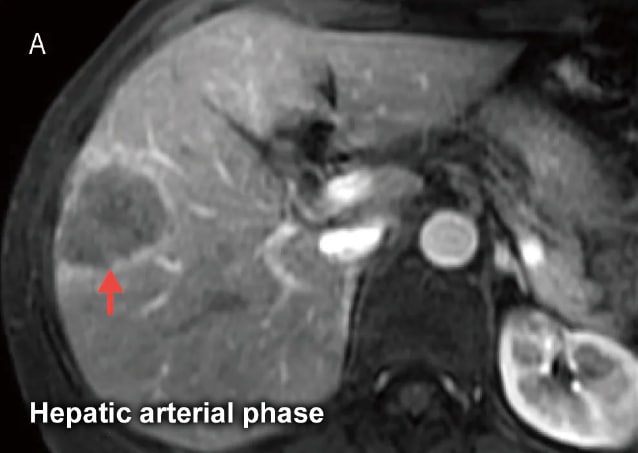
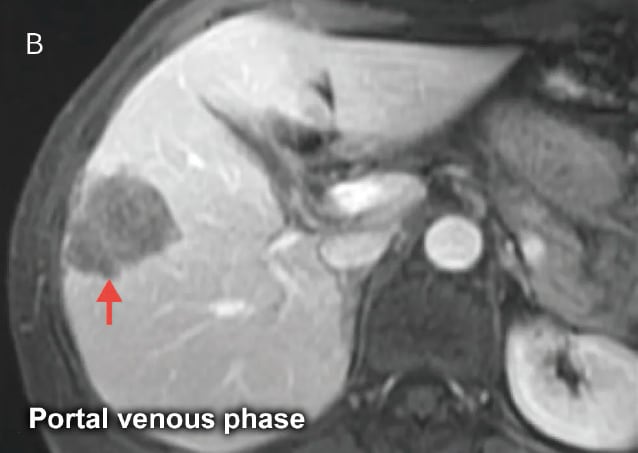
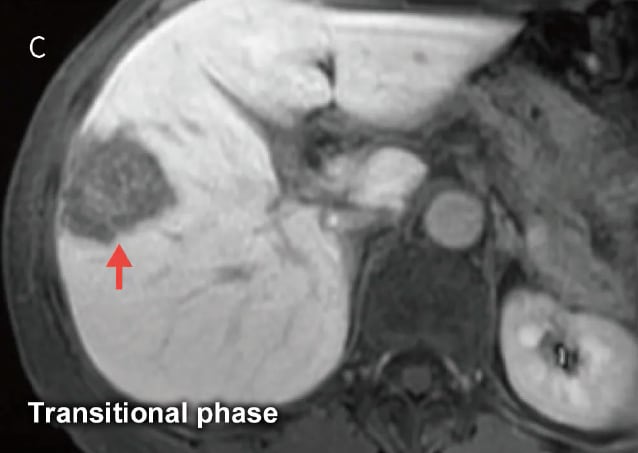
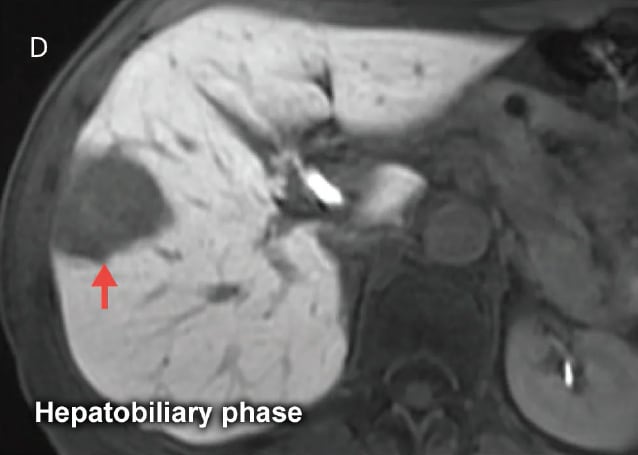
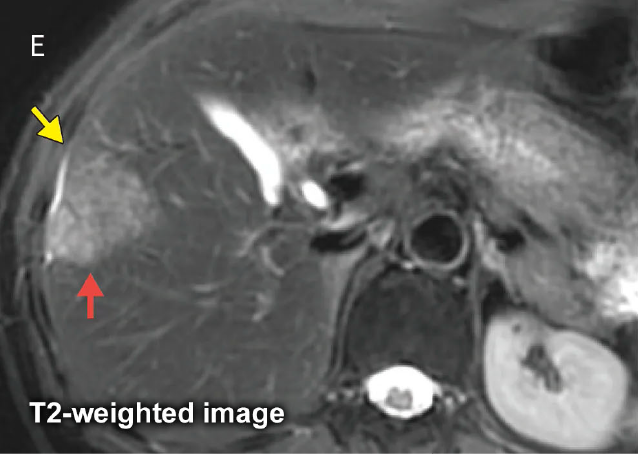
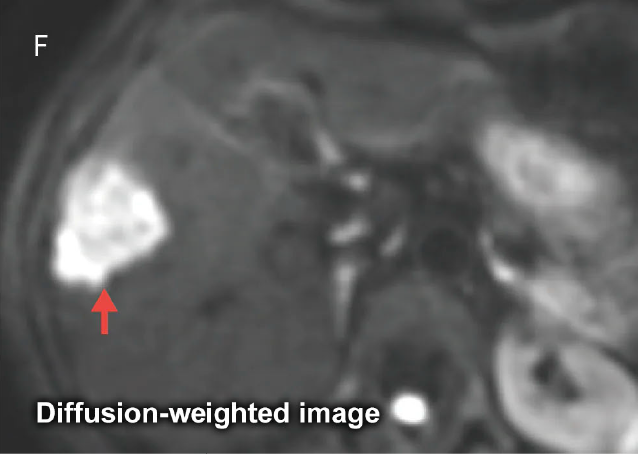
The tumor has a ring-shaped enhancement on the EOB-MRI hepatic arterial phase image (A) ( ). On the portal venous (B) and transitional phase (C) images, there is prolonged, faint enhancement within the tumor. On the hepatobiliary phase image (D), the tumor is distinctly hypointense (). On the T2-weighted image (E), the tumor is mildly-to-moderately hyperintense (), and on the diffusion-weighted image (F), the tumor is distinctly hyperintense (). Metastatic liver cancer may sometimes create a retraction in the liver surface (umbilication) (
 ).
).
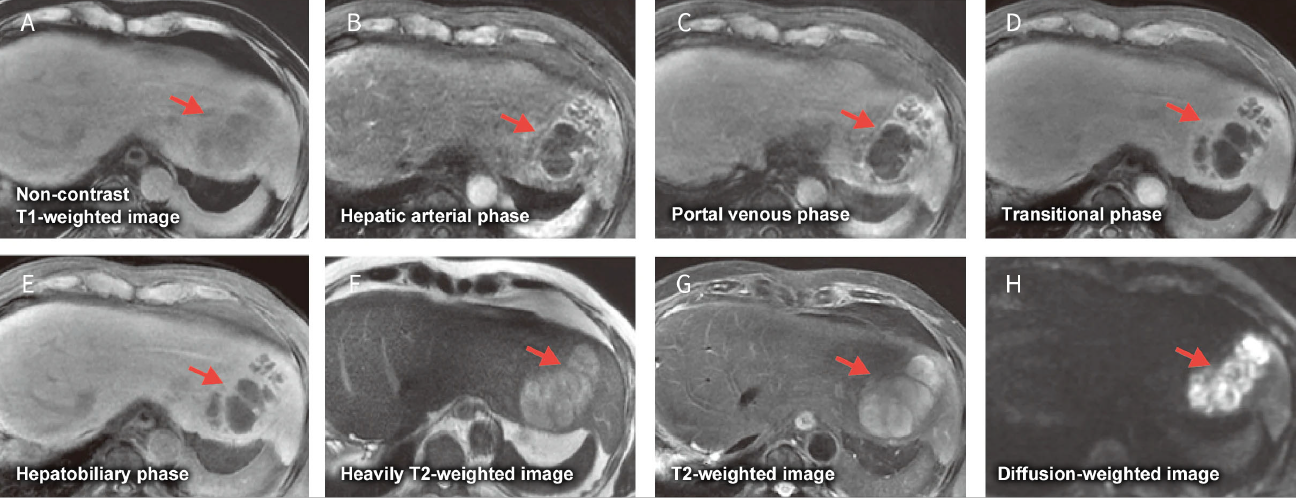
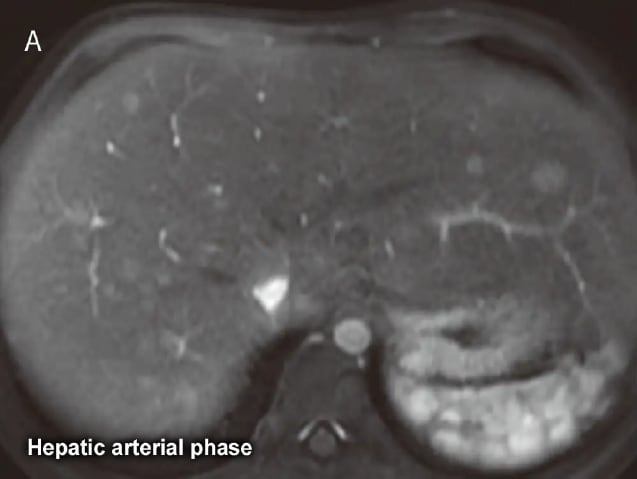
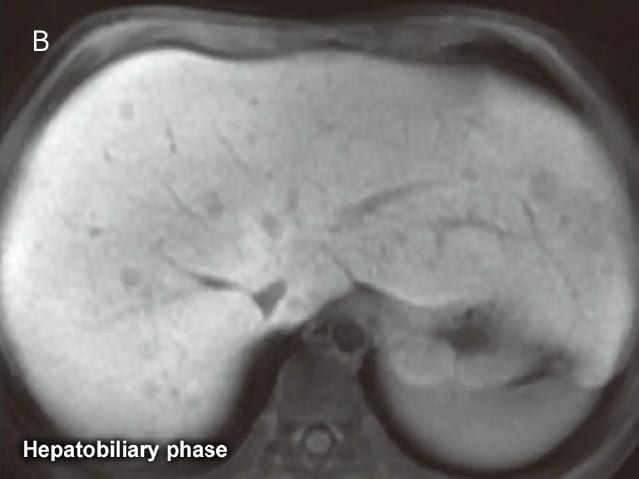
Fig. 20 Male in his 70s with metastatic liver cancer from pancreatic head cancer
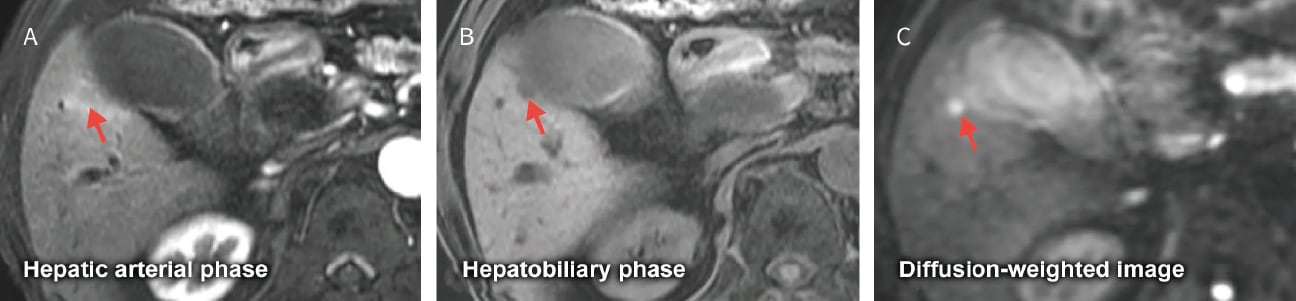
A small metastatic liver cancer in the gallbladder bed is indistinct and difficult to identify in the hepatic arterial phase (A), but is shown clearly on the hepatobiliary phase (B) and diffusion-weighted image (C).
Hemangioma
A hemangioma often has a characteristic enhancement pattern upon EOM-MRI. This pattern consists of nodular-shaped enhancement in the periphery of the hemangioma in the hepatic arterial phase, with enhancement gradually spreading inward during the portal venous and transitional phase (peripheral nodular enhancement and progressive fill-in) (Fig. 22, 23).
A bright dot sign and peripheral slight enhancement are seen in the equilibrium phase of contrast-enhanced MRI with an extracellular gadolinium-based contrast agent, but these signal patterns are difficult to discern with EOB-MRI. This is because during the EOB-MRI time phase that is equivalent to the equilibrium phase (the transitional phase) the liver parenchyma has already started taking up EOB/Primovist and shows an increased signal intensity that nullifies the contrast between the liver parenchyma and the slight enhancement in a hemangioma19,20). When hemangiomas and liver metastases are not easy to differentiate, looking carefully for homogeneous and markedly hyperintense areas in T2-weighted images and, in the limited cases, using an extracellular contrast agent in addition to EOB/Primovist is advised21).
Fig. 22 Male in his 50s with a cavernous hemangioma and multiple liver metastases from pancreatic cancer
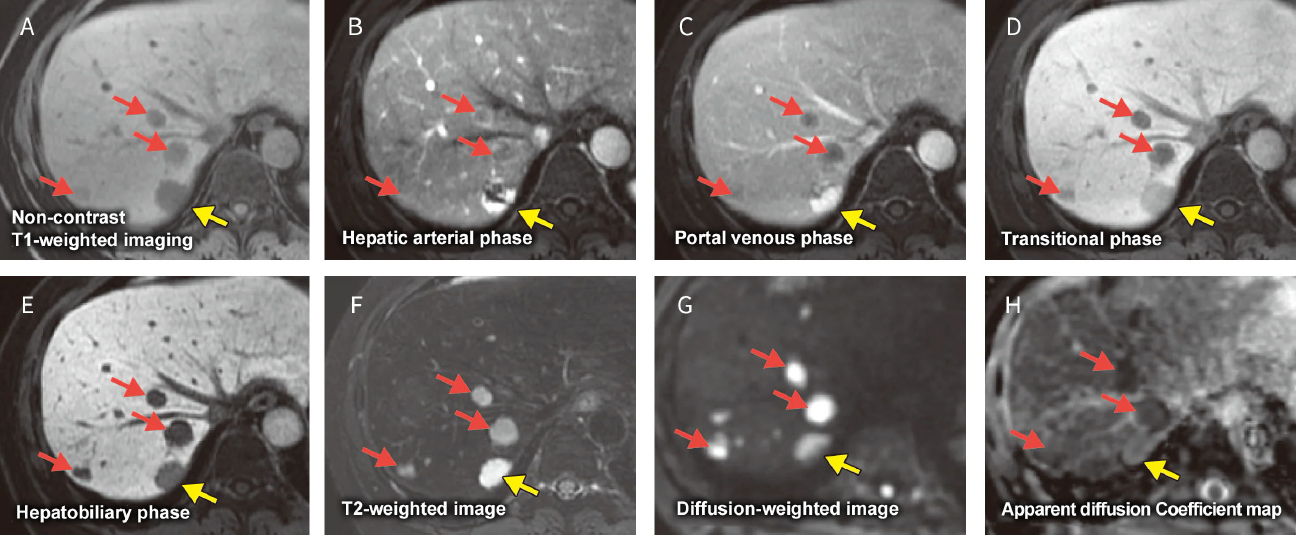
Hepatic cavernous hemangioma () and multiple liver metastases () appear as hypointense areas on non-contrast T1-weighted image (A). The hepatic cavernous hemangioma shows peripheral nodular-shaped enhancement in the hepatic arterial phase (B) and enhancement gradually spreads into the hemangioma during the portal venous phase (C). The liver metastases appear with a ring-shaped enhancement in the hepatic arterial phase (B). In the hepatobiliary phase (E), both the hepatic cavernous hemangioma and liver metastases appear as hypointense areas, though the hemangioma is slightly more intense. On T2-weighted image (F), the hepatic cavernous hemangioma appears hyperintense compared to the liver metastases and is also hyperintense on diffusion-weighted image (G), though the hemangioma has a higher ADC value than the liver metastases in the ADC map (H).
Fig. 23 Male in his 60s with hepatic cavernous hemangiomas (early enhancement type:, delayed enhancement type:)
Non-contrast T1-weighted image (A) reveals hypointensity areas in S1 and on the surface of S4 of the liver. The hepatic arterial phase (B) reveals an early enhancement hemangioma () with early punctate enhancement, and the portal venous phase (C) reveals a delayed enhancement hemangioma () with slight enhancement at the periphery of hemangioma. In the transitional phase (D) and hepatobiliary phase (E), signal intensity is increased in the liver parenchyma making it difficult to verify enhancement of either hemangioma. Both nodules demonstrate homogeneous and markedly hyperintensity on diffusion-(F), T2- (G), and heavily T2-weighted images (H).
Liver abscess
A liver abscess is broadly classified as pyogenic or non-pyogenic, where non-pyogenic abscesses include those caused by amoeba, fungi, and parasites. A liver abscess that develops from an infection disseminated from the portal venous vein commonly manifests as a solitary liver abscess, and an abscess that develops from an infection disseminated from the biliary tract commonly manifests as multiple liver abscesses. Although rare, an iatrogenic liver abscess can also develop after transcatheter arterial chemo-embolization or after radiofrequency ablation therapy for HCC.
A liver abscess forms inflammation followed by pus formation, capsular formation, and finally scarring, hence a liver abscess can manifest various imaging findings depending on the inflammatory process. On dynamic contrast-enhanced images including EOB-MRI, the liver abscess has a dual structure (double target sign) in hepatic arterial phase consisting of an isointense (or isodense) to hyperintense (or hyperdense) inner layer and a hypointense (or hypodense) outer layer surrounding the abscess (Fig. 24). These two layers represent the abscess wall and edema in the surrounding liver parenchyma, respectively22). The outer layer has become isointense as the liver parenchyma up to the equilibrium phase during dynamic imaging with an extracellular contrast agent and persists to the transitional phase on EOB-MRI as well. In the hepatobiliary phase, EOB/Primovist is taken up by edematous liver parenchyma surrounding the abscess, hence the entire hypointense area which appears on non-contrast T1-weighted images seems to be getting smaller on hepatobiliary phase images23). The hepatic arterial phase demonstrates a characteristic segmental enhancement surrounding the abscess which is a useful imaging finding for differentiating a liver abscess from hemangioma and liver metastasis.
Fig. 24 Male in his 60s with a liver abscess
Non-contrast T1-weighted imaging (A) reveals an ill-demarcated hypointense area in the lateral segment of the liver. The hepatic arterial phase imaging (B) reveals an enhanced inner layer and heterogeneous hypointense outer layer. The portal venous phase (C) and transitional phase (D) images show faint delayed enhancement, and the hepatobiliary phase image (E) shows the inner portion of the abscess as a distinct hypointensity. Heavily T2-(F), T2- (G), and diffusion-weighted (H) images show a faint hyperintensity corresponding to abscess.
Sinusoidal obstruction syndrome
Sinusoidal obstruction syndrome (SOS) represents a diffuse hemorrhage at the sinusoidal level that arises after oxaliplatin based systemic chemotherapy. SOS used to be called a veno-occlusive disease, and was known as a complication that accompanied bone marrow transplantation. SOS can reduce liver function and is also called blue liver based on gross findings during open surgery.
SOS is non-uniform changes in the entire liver parenchyma, so heterogeneous reduction of EOB uptake in the liver parenchyma is seen on hepatobiliary phase of EOB-MRI (Fig. 25). SOS sometimes manifests as nodular-shaped hypointense areas in the hepatobiliary phase that are called focal SOS. Differentiating focal SOS from liver metastasis is often problematic. Imaging findings indicative of focal SOS include heterogeneous reduction of EOB uptake in the entire liver parenchyma and nodule-shaped hypointense areas with a less distinct boundary compared to liver metastases24). Punctate or insular EOB uptake is frequently seen inside the nodule-shaped hypointense area on hepatobiliary phase images indicating residual hepatocytes inside the lesion25).
Fig. 25 Male in his 50s receiving chemotherapy (SOX) for gastric cancer
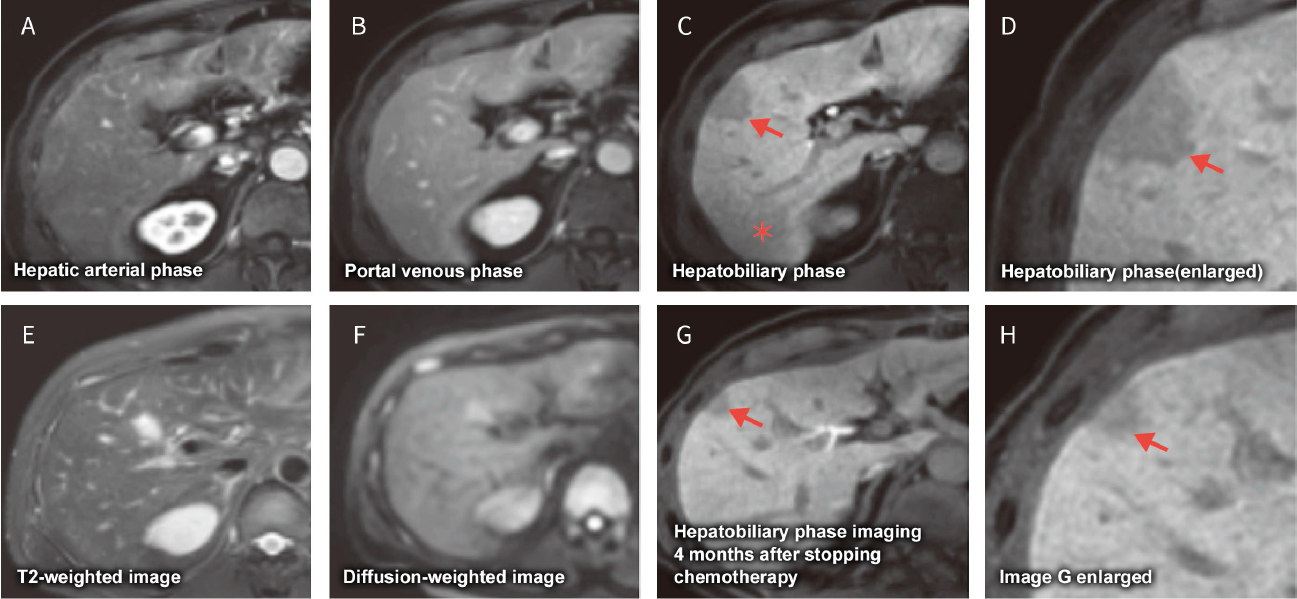
Hepatobiliary phase image (C) reveals heterogeneous and reduced uptake of EOB/Primovist in the entire liver and a faint and ill-demarcated hypointense area (*). Hepatobiliary phase images (C, D) reveal a nodule-shaped hypointense area in segment 5 of the liver () not seen on other images. Hepatobiliary phase image (G) obtained four weeks after finishing chemotherapy reveals some improvement of EOB/Primovist uptake in the liver parenchyma and shrinkage of the nodular-shaped hypointense area in segment 5. There is also a faintly punctate region of EOB/Primovist uptake within the nodular-shaped hypointense area.
Hepatocellular adenoma
The 2010 WHO classification recognized four subtypes of hepatocellular adenoma: HNF1α inactivated hepatocellular adenoma (H-HCA), inflammatory HCA (I-HCA), beta-catenin activated HCA (B-HCA), and unclassified HCA (U-HCA) (Fig. 26, 27). Although imaging findings vary depending on subtype, H-HCA is the most common subtype in Japan and appears as a fat-containing hypervascular tumor. Focal nodular hyperplasia (FNH) is a benign tumor that also develops in a healthy liver, and EOB-MRI hepatobiliary phase imaging is useful for distinguishing between these two pathologies. A previous report clearly demonstrated the difference between these two pathologies in the hepatobiliary phase, 62 of 68 FNH (91%) were isointense to hyperintense while 40 of 43 hepatocellular adenoma (94%) were hypointense26). FNH is usually followed-up without treatment while hepatocellular adenoma has a risk of growth, intratumor hemorrhage, and carcinogenesis. Surgery is consensually recommended for hepatocellular adenoma larger than 5 cm27).
Fig. 26 Male in his 10s with hepatocellular adenoma (classification unknown) secondary to type I glycogen storage disease
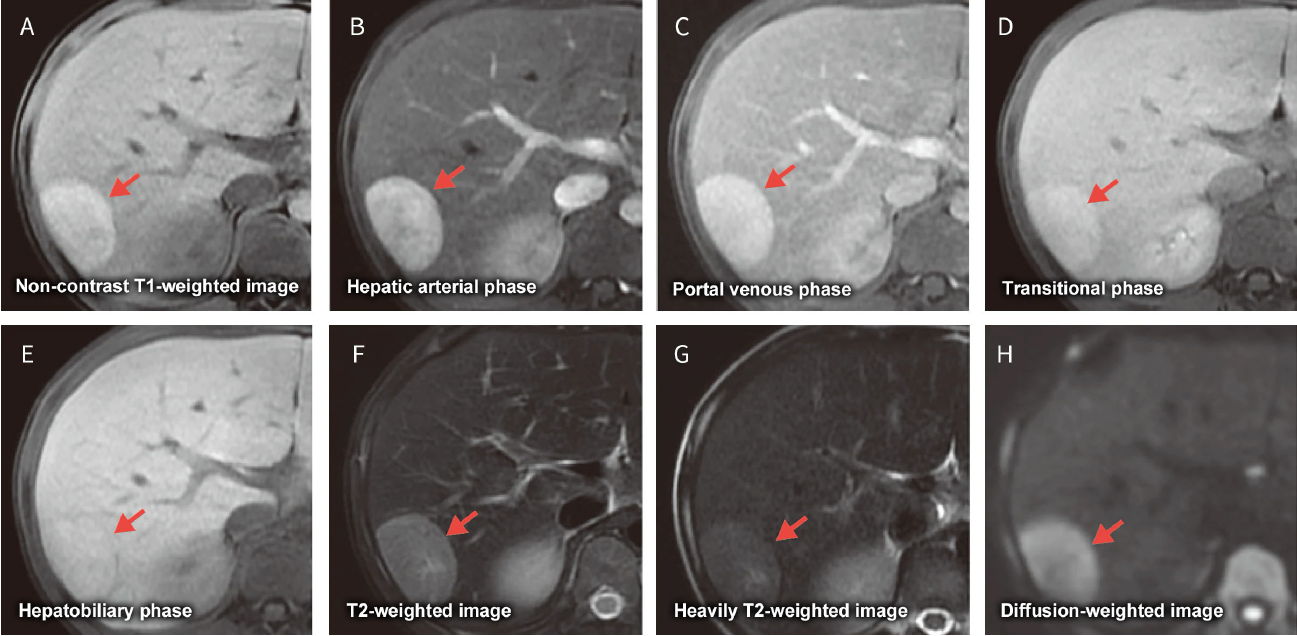
The non-contrast T1-weighted image (A) shows an hyperintense area representing a relatively high cellular density (). The hepatic arterial phase image (B) reveals slightly increased arterial blood flow compared to the non-contrast image, but portal venous (C) and transitional phase (D) images show no washout. The hepatobiliary phase image (E) shows EOB/Primovist uptake by the surrounding liver but no signal change inside the lesion compared to the non-contrast image. The T2- (G), heavily T2- (H), and diffusion-weighted (F) images all show a faintly hyperintense area corresponding to the lesion.
Fig. 27 Male in his 10s with multiple hepatocellular adenomas (classification unknown) secondary to type I glycogen storage disease
The hepatic arterial phase image (A) shows countless tiny early enhancing nodules in the liver that all appear hypointense on hepatobiliary phase image (B).
