


Introduction to Liver MRI for Surgeons
- Diagnosis of Metastatic Liver Cancer -
Imaging investigations used in liver tumor diagnosis and liver MRI basics (3)
Typical Sequences of liver MRI images9)
Images provided by: Hamamatsu University School of Medicine
T1-weighted images
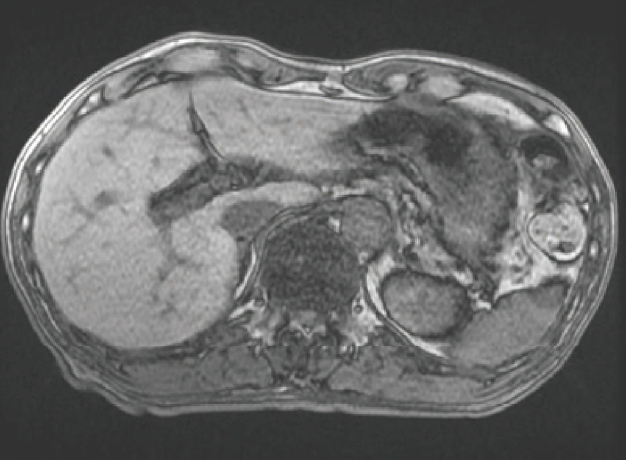
Normal liver parenchyma has a homogeneous signal intensity. On T1-weighted images, normal liver parenchyma has a moderate signal intensity (hyperintense compared to skeletal muscle) and is hyperintense compared to the spleen and kidneys. Normal liver parenchyma often has about the same signal intensity as pancreatic parenchyma (Fig. 12, 13).
On T1-weighted images, subcutaneous tissue and adipose tissue in the abdominal cavity are distinctly hyperintense, creating an easy-to-identify contrast between the contours of the liver and other intraperitoneal organs and the fat that surrounds them. Blood vessels in the liver (portal vein and hepatic veins) are also distinctly hypointense and intrahepatic blood vessels are a useful means of identifying liver segments.
Fig. 12 T1-weighted image (in-phase, TE = 4.17 msec)
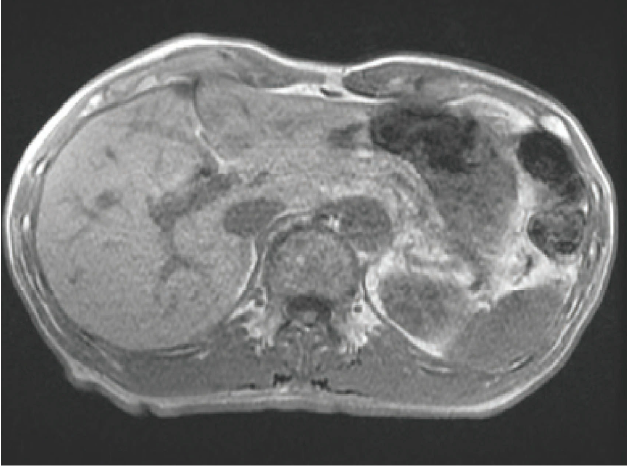
Fig. 13 T1-weighted image (out-of-phase, TE = 2.08 msec)
T2-weighted images
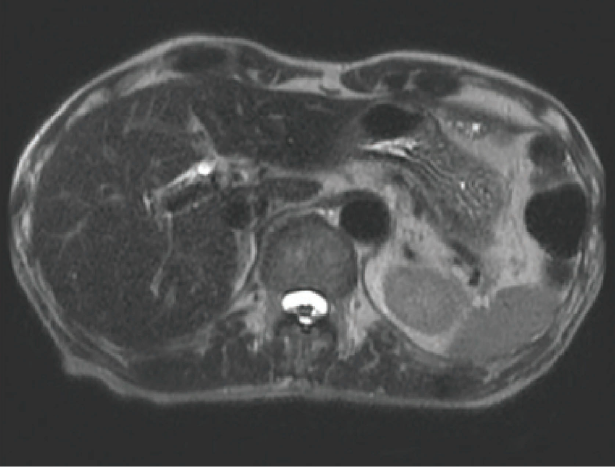
On T2-weighted images, the liver parenchyma has a fairly low but homogeneous signal intensity (Fig. 14, 15). The intrahepatic portal and hepatic veins do not have a fixed intensity but can appear hyperintense or hypointense depending on imaging conditions and the direction and velocity of blood flow. Consequently, caution is required when judging if an image shows normal blood flow or occlusion due to thrombus or tumor embolism.
Fig. 14 Fat-suppressed T2-weighted image
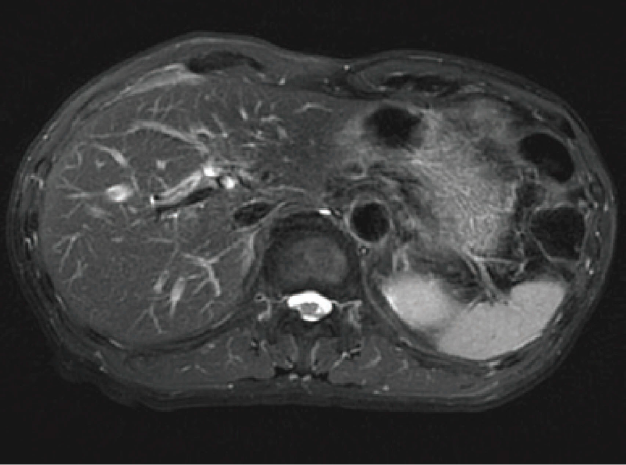
Fig. 15 Heavily T2-weighted image (TE = 150 msec)
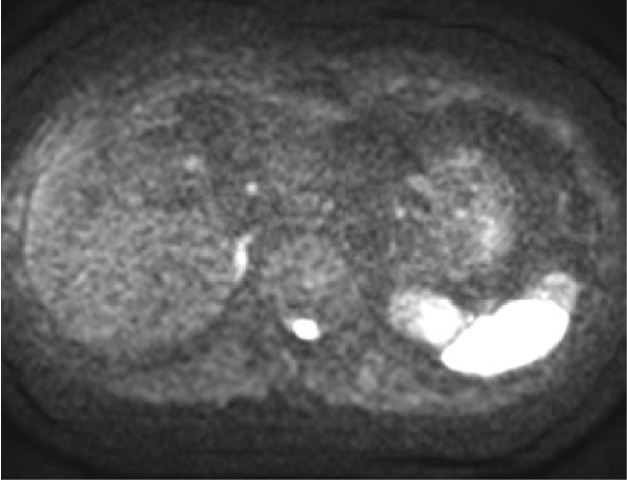
Diffusion-weighted images
On diffusion-weighted images, normal liver parenchyma has a relatively low signal intensity (Fig. 16) and tumors and other lesions are shown as hyperintense areas within the normal liver parenchyma. Because the diffusion-weighted imaging sequence uses echo planar imaging (EPI), it has a lower spatial resolution than other imaging sequences and is more susceptible to image artifact-induced distortion. For this reason, anatomical structures must be identified by cross-referencing diffusion-weighted images with other images. Some medical facilities may also show diffusion-weighted images with black and white inversed (hyperintense areas in black and hypointense areas in white). When black and white are inversed, caution is required as the relationship between strong and weak signals and black and white structures is reversed. How diffusion-weighted images are displayed is not standardized and is at the discretion of the physician or technologist in the facility. However, the two display methods are easy to distinguish; black and white are reversed when the empty background around the subject is white.
Fig. 16 Diffusion-weighted image (b = 1,000 sec/mm2)
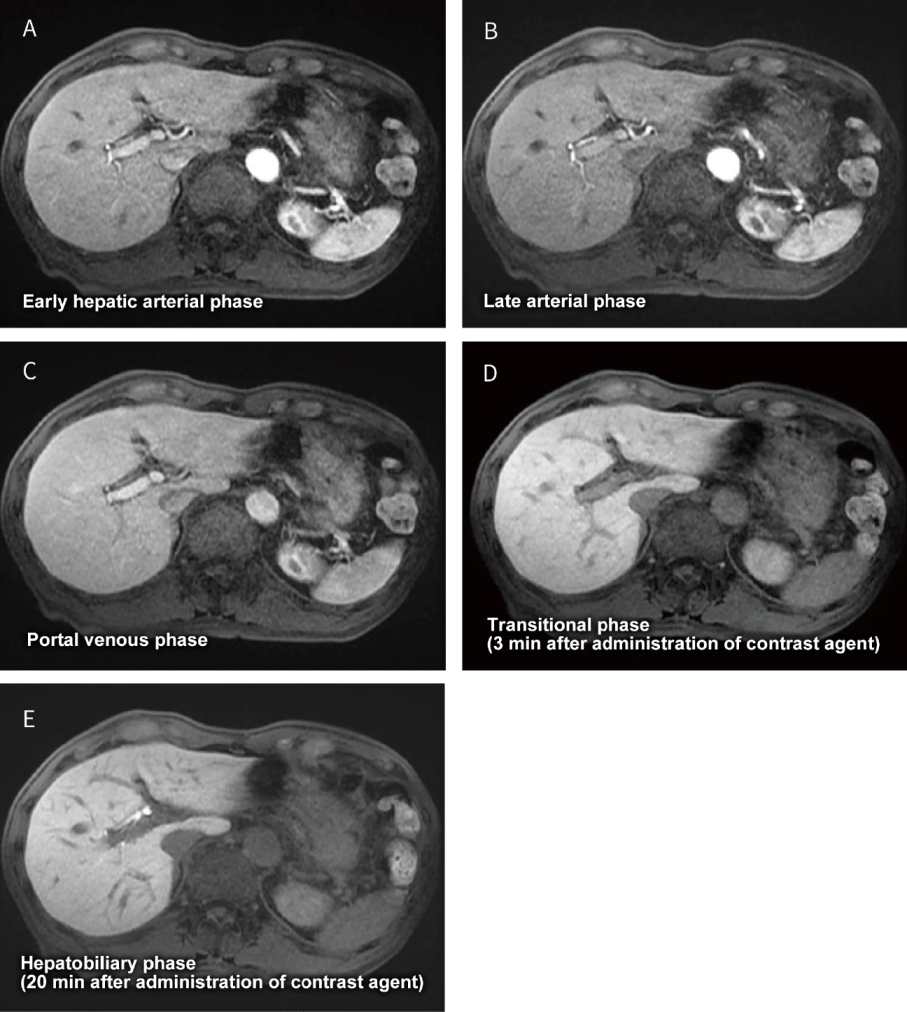
Dynamic contrast enhancement
Fig. 17 Images from each phase of dynamic contrast-enhanced imaging
Detecting metastatic liver cancer with EOB-MRI
EOB-MRI and metastatic liver cancer10,11)
Most metastatic liver cancers are hypointense to isointense on T1-weighted images. On T2-weighted images, they appear moderately hyperintense (a signal intensity between liver parenchyma and the gallbladder), but caution is also required as metastatic liver cancer can appear strongly hyperintense like the gallbladder in cases with pronounced necrosis or mucinous degeneration. In diffusion-weighted images, metastatic liver cancer often appears markedly hyperintense.
Hypervascular metastatic liver cancer is normally derived from a primary neuroendocrine tumor, renal cell cancer, melanoma, or thyroid cancer, while hypovascular metastatic liver cancer is normally derived from a primary lung, breast, gastric, or colorectal cancer. Dynamic contrast-enhancement with EOB/Primovist produces different patterns depending on the primary lesion, though metastases from colorectal cancer (a very common cancer) typically appear in the hepatic arterial phase as a hypovascular tumor with ring-shaped enhancement at the periphery of the lesion. In the portal venous phase and transitional phases, metastases demonstrate slight hypointensity compared to the surrounding liver parenchyma with a delayed enhancement in the central portion of the lesion. This enhancement pattern is believed to reflect high tumor cell density and inflammatory response at the periphery of the lesion, and necrosis and degeneration at the central portion of the lesion. Contrast patterns that appear from the hepatobiliary phase obtained in 20 minutes after EOB/Primovist administration reflect the presence or absence of hepatocellular function. Metastatic liver cancer has no hepatocytes and appears hypointense compared to the surrounding liver parenchyma in the hepatobiliary phase, which is helpful in diagnosing metastatic lesions that are undetectable or difficult to differentiate by dynamic contrast-enhancement images alone.
Typical EOB-MRI imaging sequences (Table 3)8)
[Plain MRI]
- (1)T1-weighted images
For liver MRI, a breath-hold T1-weighted gradient-echo in- and out-of-phase sequence is essential. Evaluates the interior of the lesion and the fat content of the liver. - (2)T2-weighted images
T2-weighted images are also essential, and a respiratory-triggered fat-suppressed fast spin-echo sequence and breath-hold single-shot fast spin-echo sequence are recommended. Performing additional heavily T2-weighted imaging (TE ≥ 150 msec) is also helpful in distinguishing between the cysts with high T2 values, hemangiomas, and other malignant tumors. - (3)Diffusion-weighted images
An echo-planar diffusion-weighted imaging sequence is also recommended (normally, b-factor ≥ 400 sec/mm2). - (4)Other
Fat-suppressed steady-state coherent images (true FISP, balanced FFE, FIESTA, true SSFP) are recommended.
【EOB-MRI】
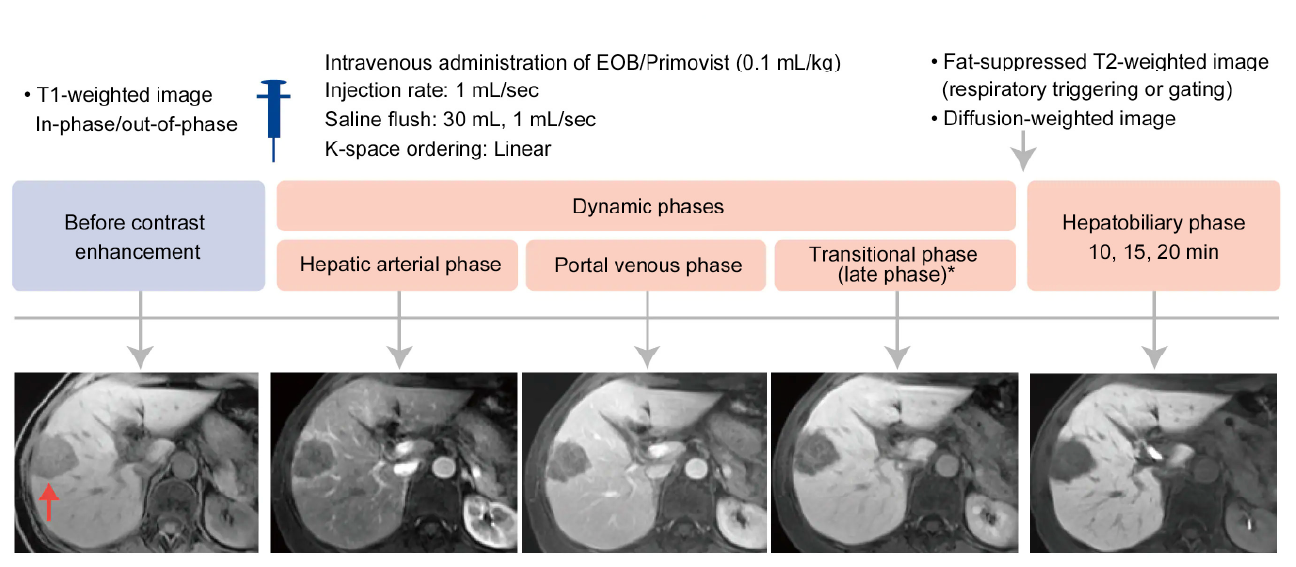
EOB-MRI is used for dynamic and hepatobiliary phase imaging. MRI examination times may be shortened by performing EOB dynamic contrast-enhancement just after non-contrast T1-weighted imaging, followed by acquiring T2-weighted, diffusion-weighted, and steady-stage coherent images before performing hepatobiliary phase imaging (Fig. 18).
Table 3 EOB-MRI protocols (essential)
| Imaging method | Purpose |
|---|---|
| Non-contrast-enhanced MRI | |
| Breath-hold T1-weighted image in-phase/out-of-phase |
|
| Respiration-triggered fat-suppressed T2-weighted image |
|
| Diffusion-weighted image (either respiratory-triggered or not) |
|
| EOB-MRI | |
| Dynamic contrast-enhancement (hepatic arterial phase/portal venous phase/transitional phase) |
|
| Fat-suppressed T1-weighted image (10, 15, 20 minutes) |
|
Fig. 18 A common EOB-MRI examination workflow
* Called the transitional phase (late phase) in EOB-MRI. The term equilibrium phase is not used in EOB-MRI.
