

One patient with whom the extent of progression of perihilar cholangiocarcinoma was evaluated by dynamic computed tomography (CT)
Hamamatsu University School of Medicine
Drs. Satoshi Goshima, Shintaro Ichikawa, and Yukichi Tanahashi, Dept. of Diagnostic Radiology and Nuclear Medicine
Dr. Takashi Oba, Dept. of Radiology, Hamamatsu University Hospital
DATE : 2021
General
1. Roles of contrast computed tomography (CT) in the abdominal region (especially for hepato-bili-ary-pancreatic diseases), and approaches to setting protocols
For any hepato-biliary-pancreatic disease, blood flow information obtained by multiphase imaging is indispensable for primary lesion detection, qualitative diagnosis, disease stage diagnosis, therapeutic efficacy determination, and postoperative complication screening(1). Patients with malignant tumors are often followed up after treatment, and contrast CT in the portal phase is then in general use.
Although contrast magnetic resonance imaging (MRI) with Gadoxetate disodium(Gd-EOB-DTPA) is recommended for detection of primary and metastatic liver cancer(1), there are difficulties with MRI throughput, etc., and contrast CT remains in frequent use in clinical practice.
Qualitative diagnosis of hepatocellular carcinoma (HCC) is made on the basis of wash-out and capsule dark staining in the portal and/or equilibrium phases, following from dark staining in the arterial phase. Optimization of the arterial phase is important, because detection of intra-lesional hypervolemia in not only hypervolemic HCC but also ischemic HCC enables treatment.
In addition, for localized treatments such as surgery, radiofrequency ablation, and transcatheter arterial embolization, elucidation of the relationship between the lesion and intrahepatic blood and lymphatic vessels is important for the treatment strategy. In gallbladder cancer, bile duct cancer, and pancreatic cancer, the dark staining pattern differs according to the proportions of tumor cell components and fibrous interstitial tissue components.
If the content of tumor cell components is high, dark staining in the arterial phase is often seen, whereas if the content of fibrous interstitial tissue components is high this leads to delayed dark staining in the equilibrium phase. Diagnosis in both the portal and equilibrium phases is necessary for determining the resection range and locating hepatic metastases. As there is a limit to the detection capacity of contrast CT for hepatic metastases, if signs suggesting hepatic metastases are detected by contrast CT in accordance with the appropriate imaging protocol, it is preferable to then be proactive in performing additional Gadoxetate disodium(Gd-EOB-DTPA) contrast MRI.
2. Features of the technology installed in the CT device
The device used with this patient, Revolution CT (GE Healthcare), is equipped with a detector that has 256 rows, each 0.625 mm wide. Using a garnet scintillator with luminescence sensitivity 100 times the conventional ratio, and a high-performance generator, scattered radiation was eliminated efficiently with a high-performance, three-dimensional collimator. Therefore, even with dual-energy imaging by ultrafast kV switching at 0.25 ms, high-performance image quality and high-precision quantitativity can be combined. In addition, by equipping the device with a GSI Xtream Smart Workflow, it is possible to perform simultaneous parallel calculations even during imaging, so that no problems occur during routine use even with dual-energy imaging. Furthermore, the device can be used for CT with a plane detector, and is also used in blood-flow analysis with Perfusion, 4D-DSA, etc. Having this high basic performance, the newly installed Deep Leaning image-reconstruction system enables favorable noise elimination even with dual-energy and low-voltage imaging, and its use in clinical practice is continuing to expand and become more widespread.
References
1. Japan Radiological Society (ed.): Diagnostic Imaging Guidelines, 2016.
Introduction

Patient’s background
Male; 70s; body weight: 48 kg; perihilar cholangiocarcinoma
Assessment objectives
With jaundice as the primary complaint, the patient was examined by a local physician, and obstructive jaundice due to perihilar cholangiocarcinoma was suspected, so he was referred to the authors’ hospital, and dynamic CT was performed as preoperative thorough examination.
Contrast agent used
Iopromide 370 injection syringe, 77 mL
Case explanation
In the case of perihilar cholangiocarcinoma, accurate evaluation of the extent of lesion progression (horizontal extension) along the bile duct wall is important for deciding upon the surgical method. With the present patient, although extensive wall thickening was found on the duodenal side, wall thickening on the hepatic side extended no further than the right and left hepatic ducts. Therefore, the surgery performed was right hepatic lobectomy + extrahepatic cholangectomy + cholecystectomy. A negative resection margin was demonstrated by postoperative pathological examination. Cholangiocarcinoma is a type of tumor with abundant fibrous components, characterized by delayed deep staining. Therefore, the equilibrium phase is often useful for evaluating the extent of lesion progression, and detailed evaluation, with reference to thin-slice and multiplanar-reformation images, is necessary.
Imaging findings
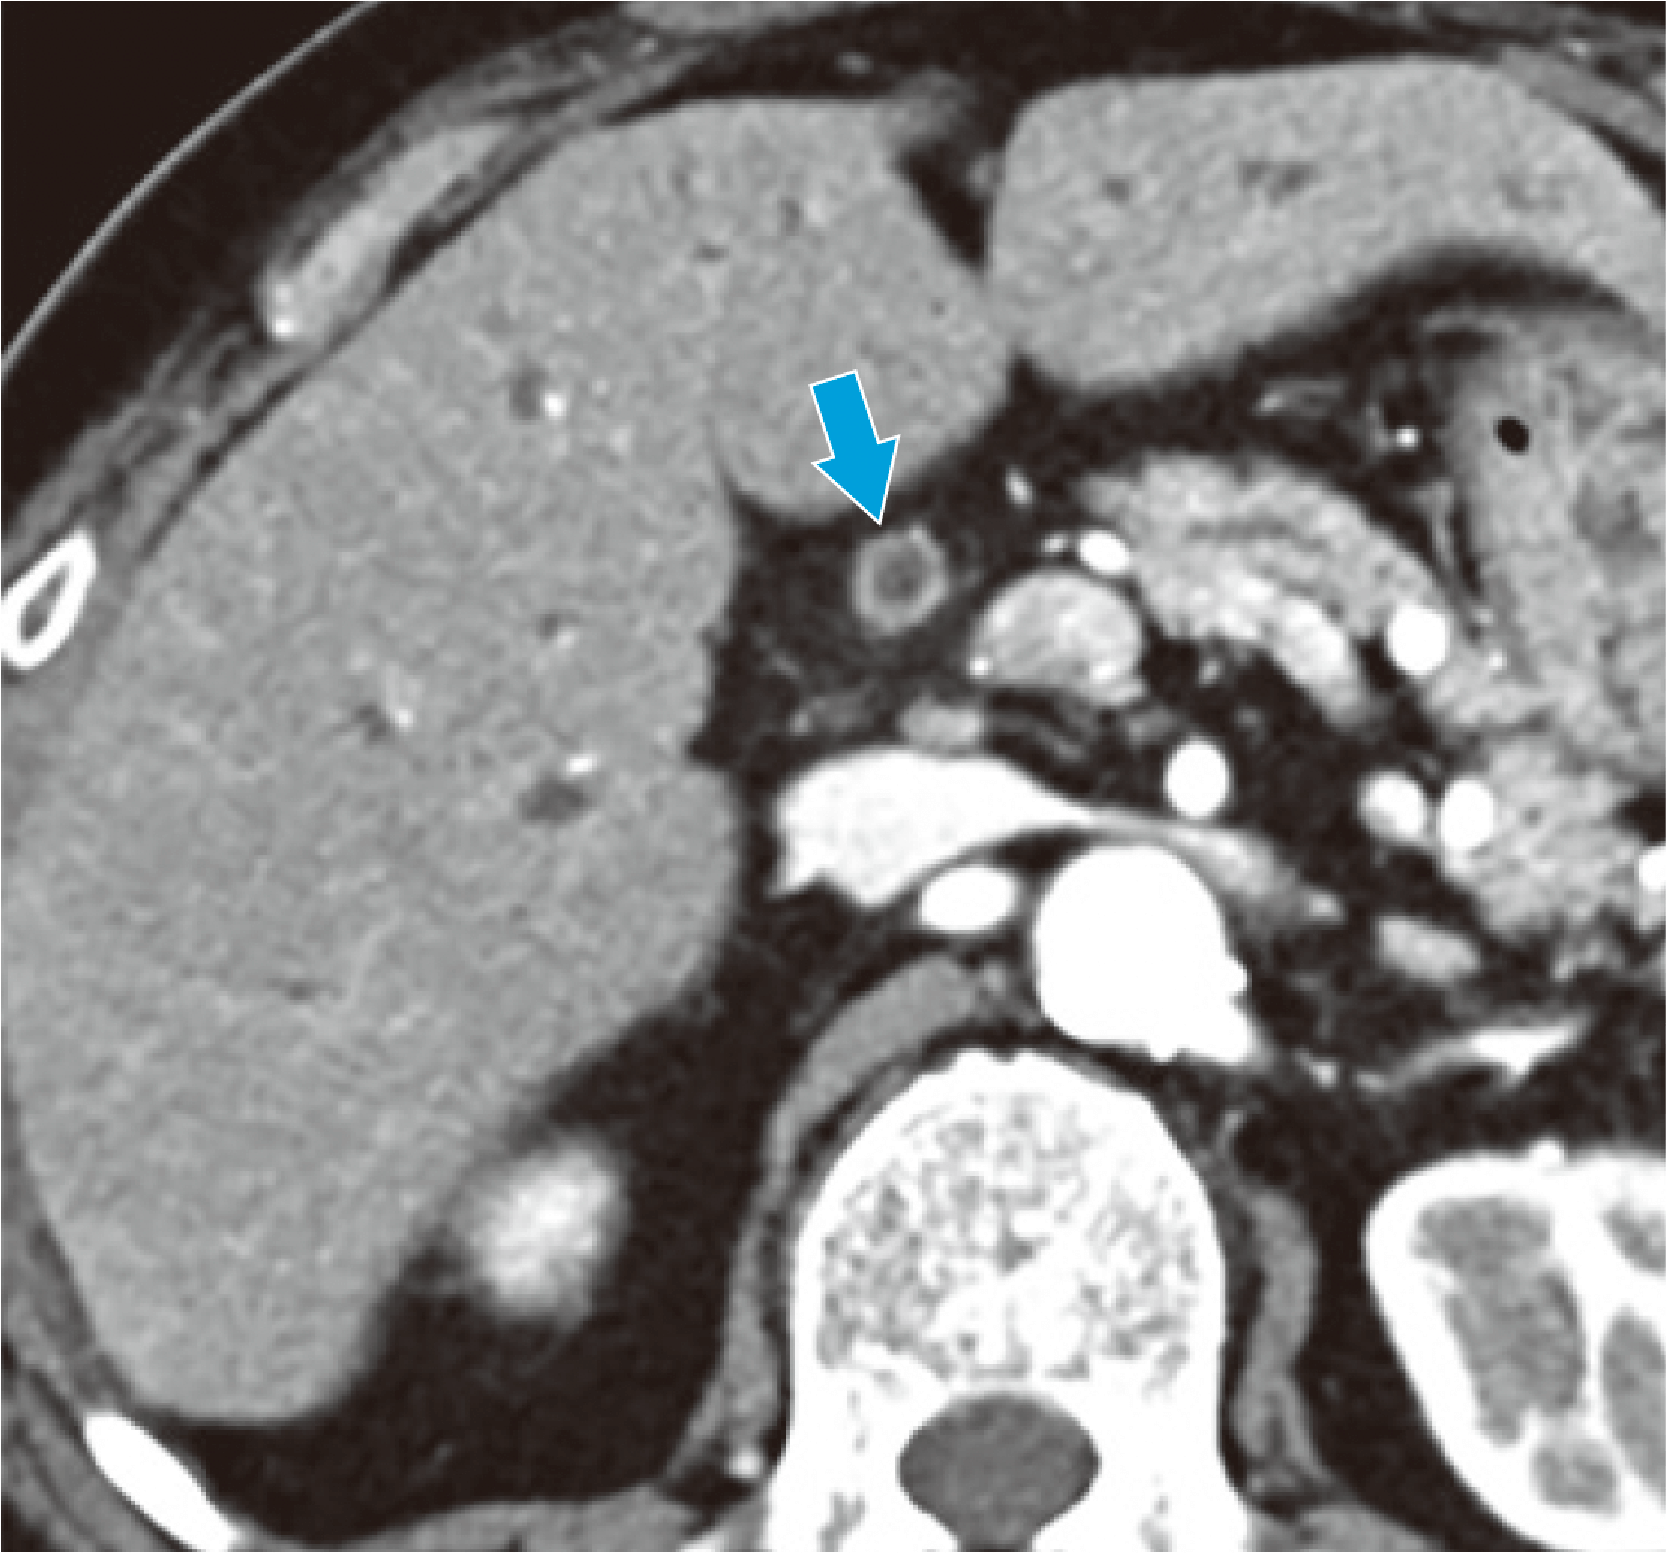
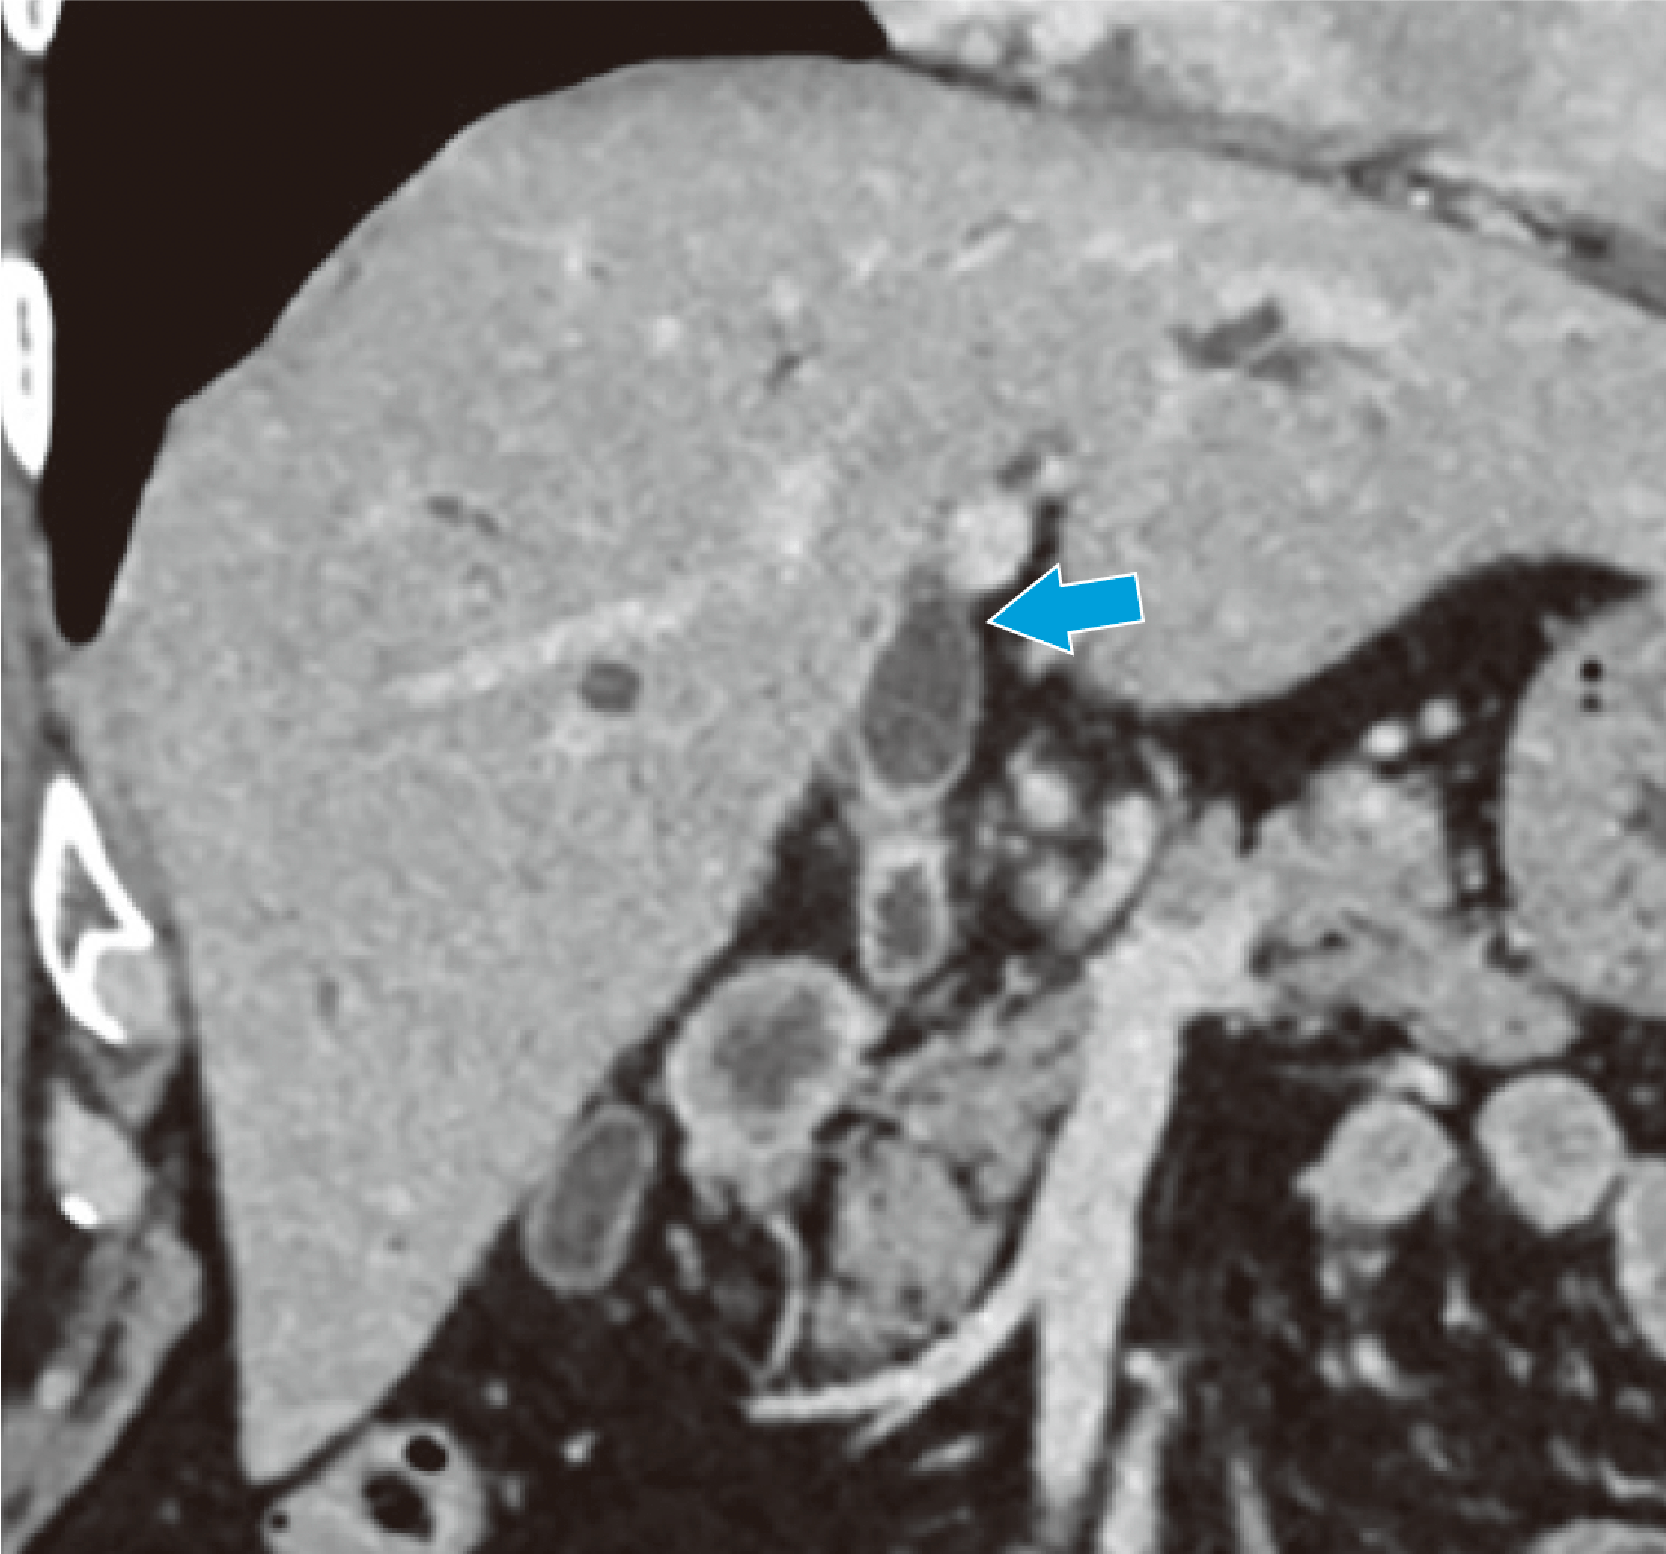
Full-circumference bile duct wall thickening can be seen, centered on the perihilar bile duct (➡).
Fig. 1. Horizontal section in the arterial phase
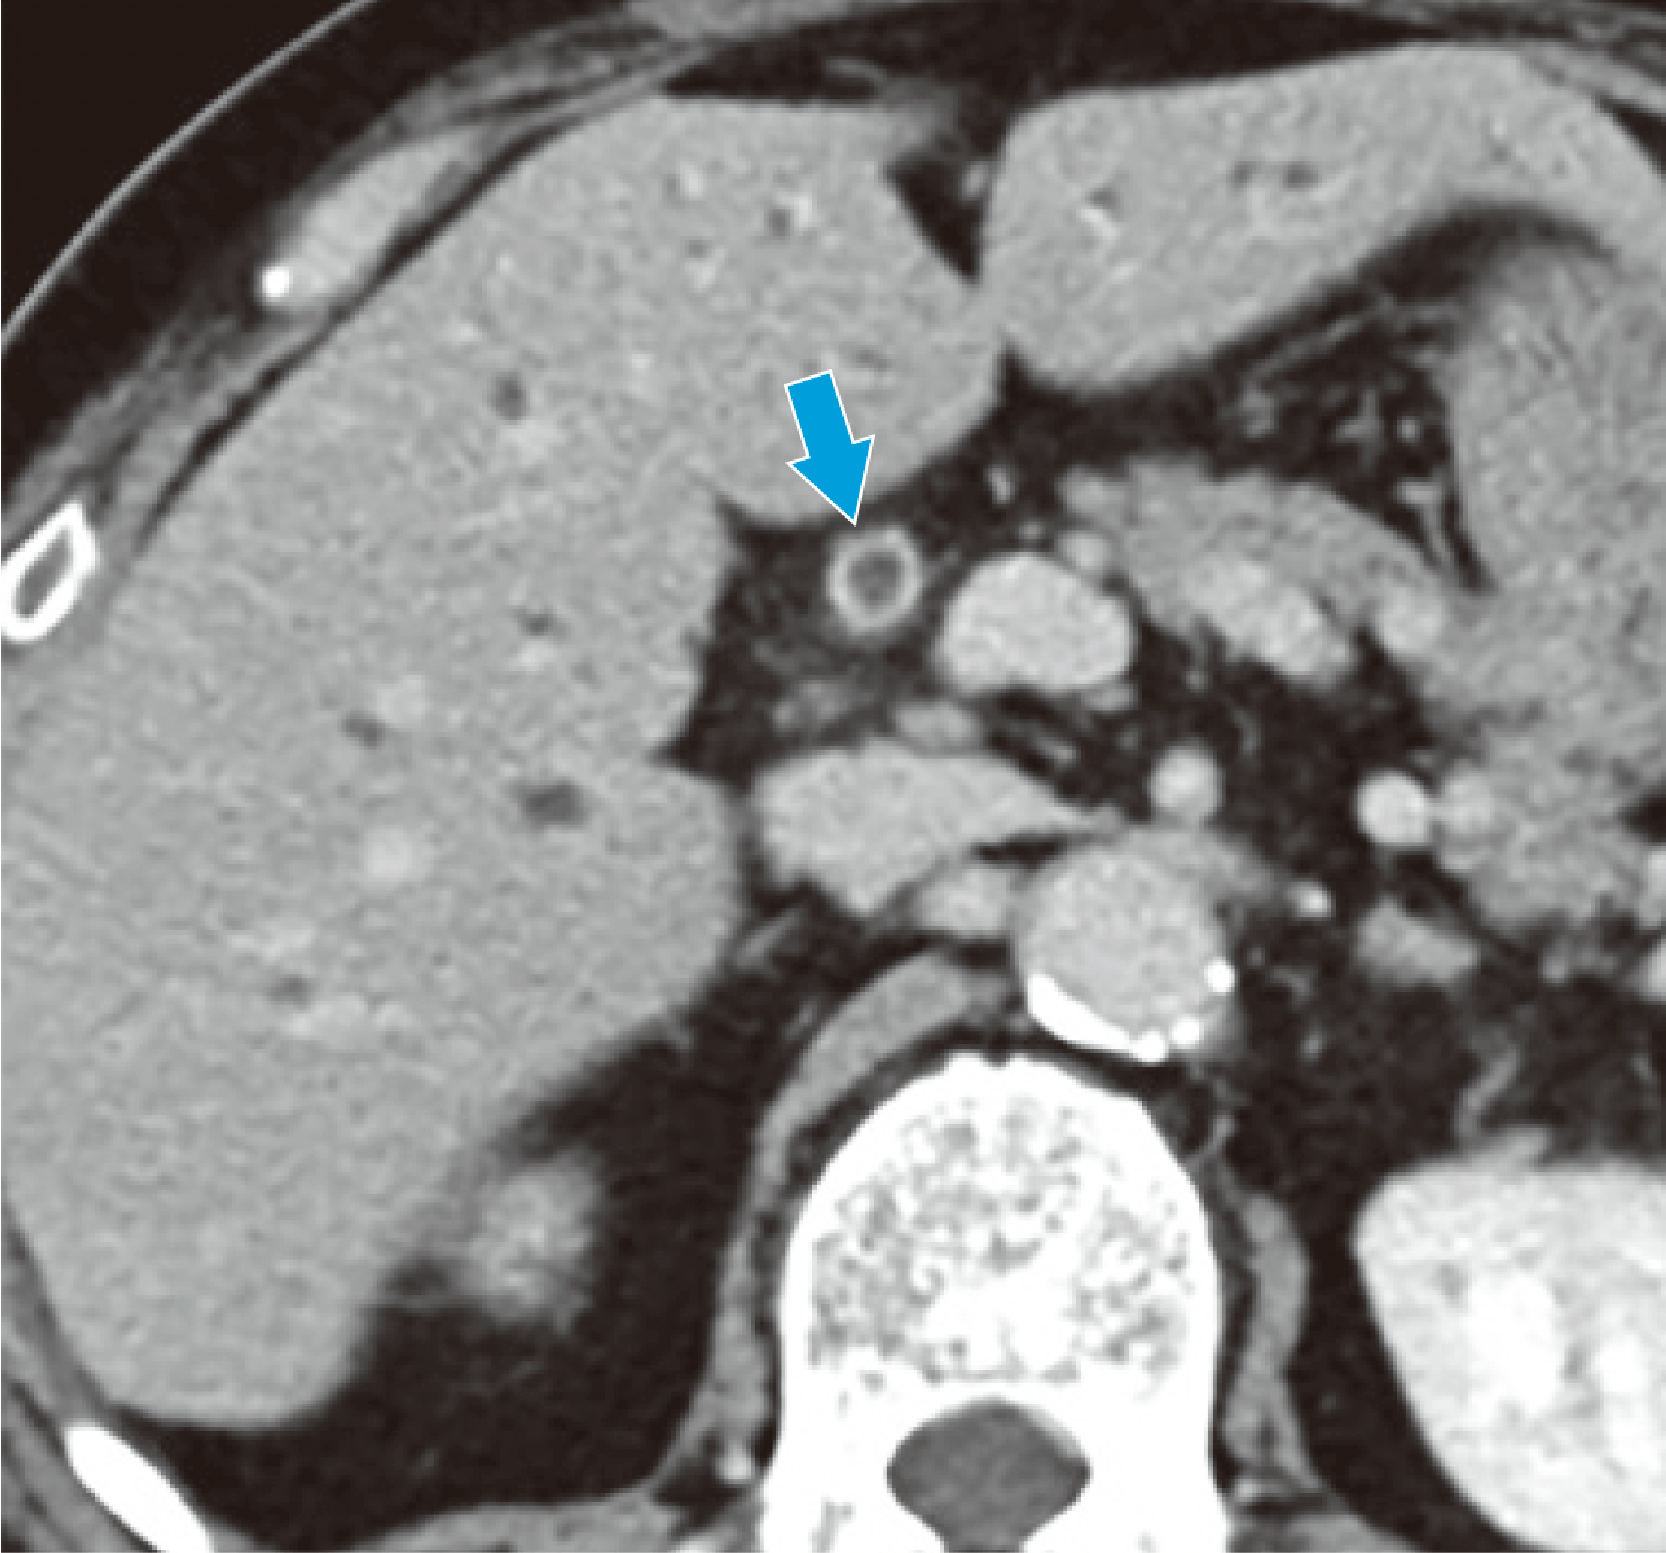
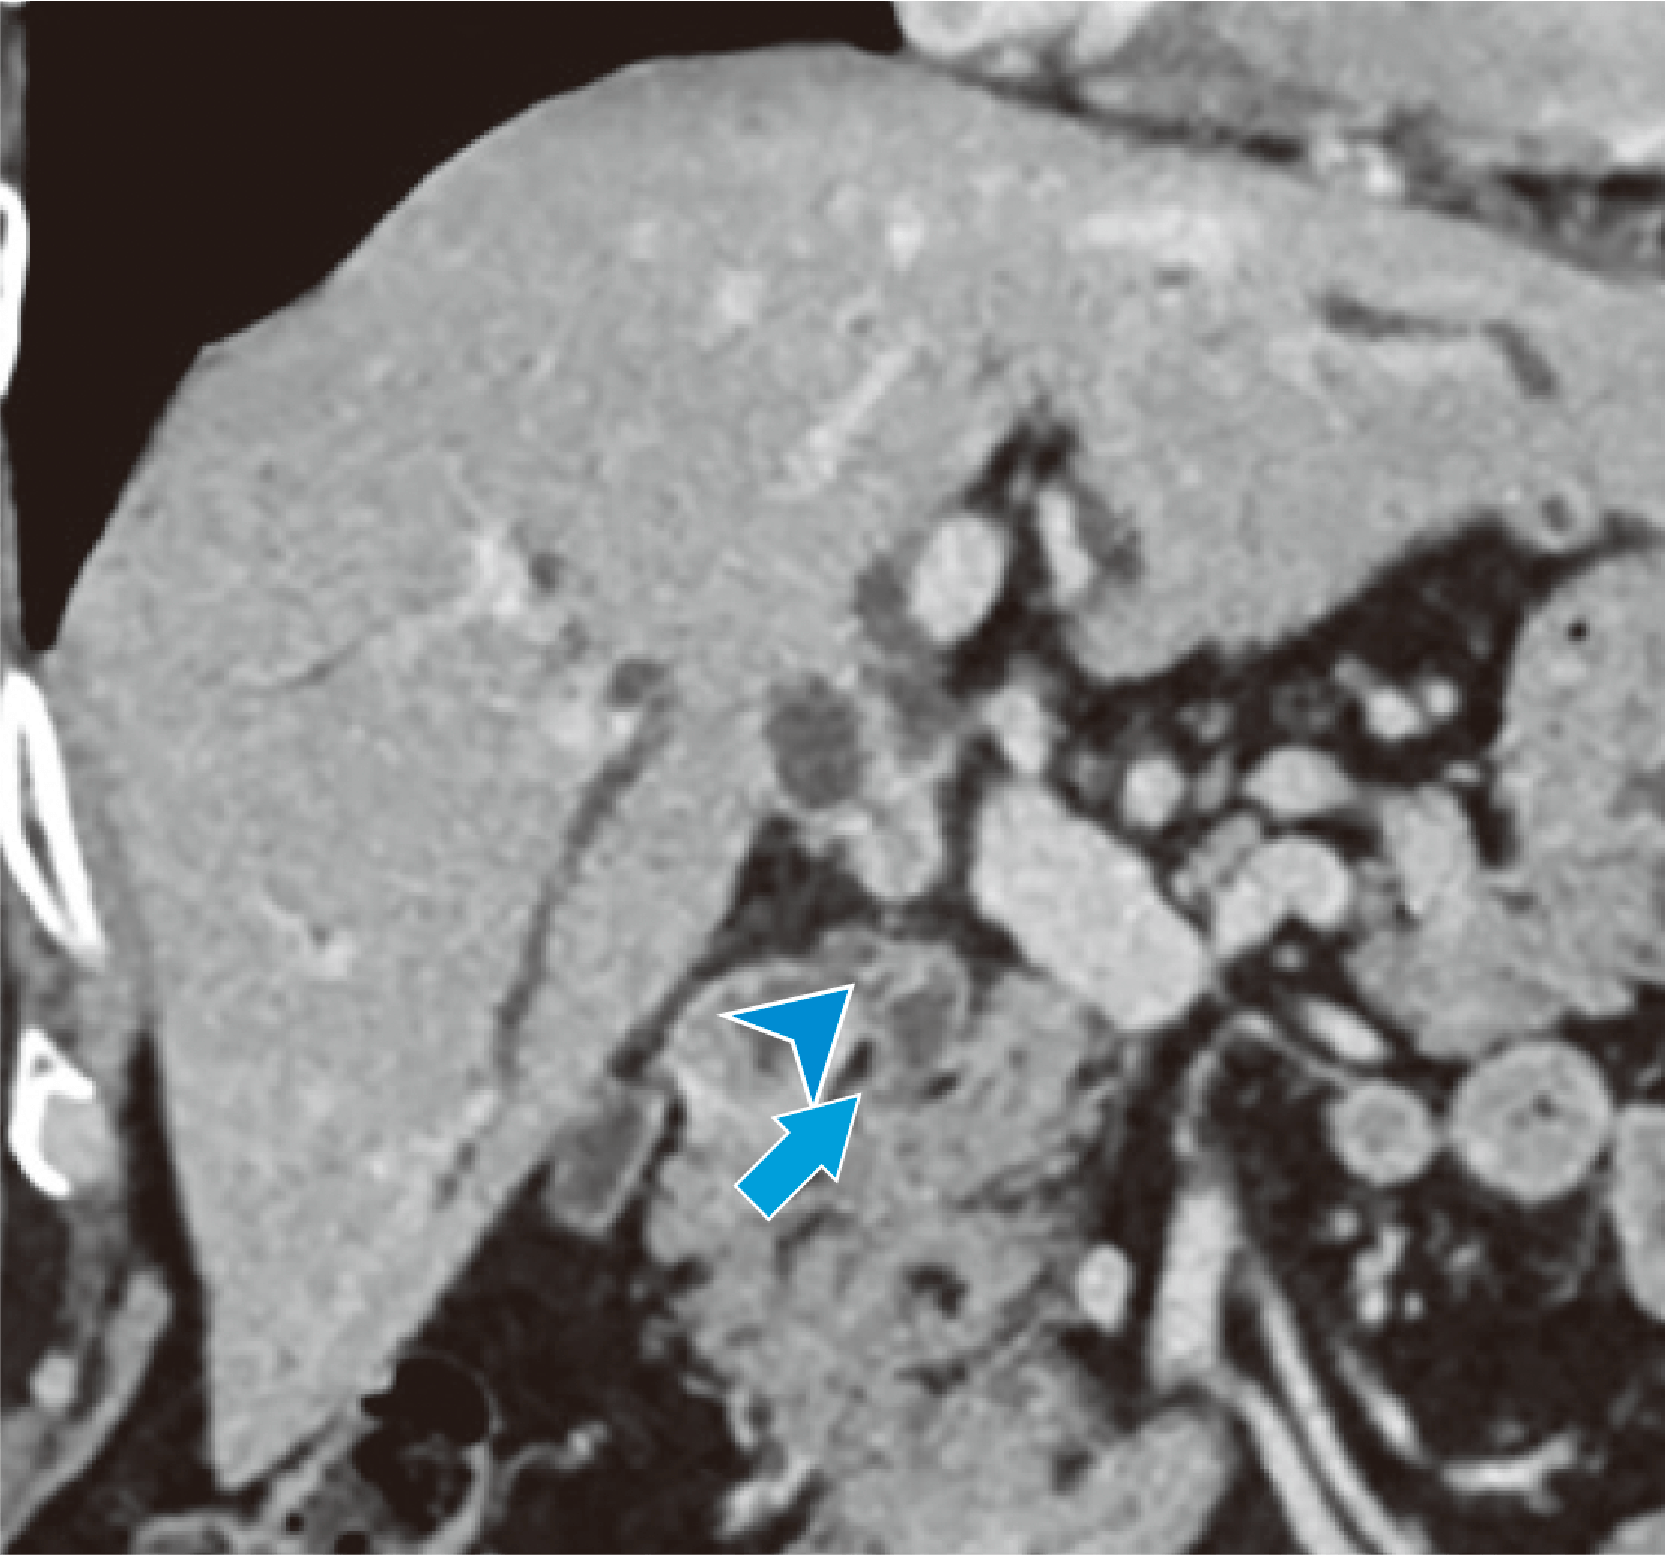
Contrast enhancement is more marked than in the arterial phase (delayed dark staining; ➡).
Fig. 2. Horizontal section in the equilibrium phase
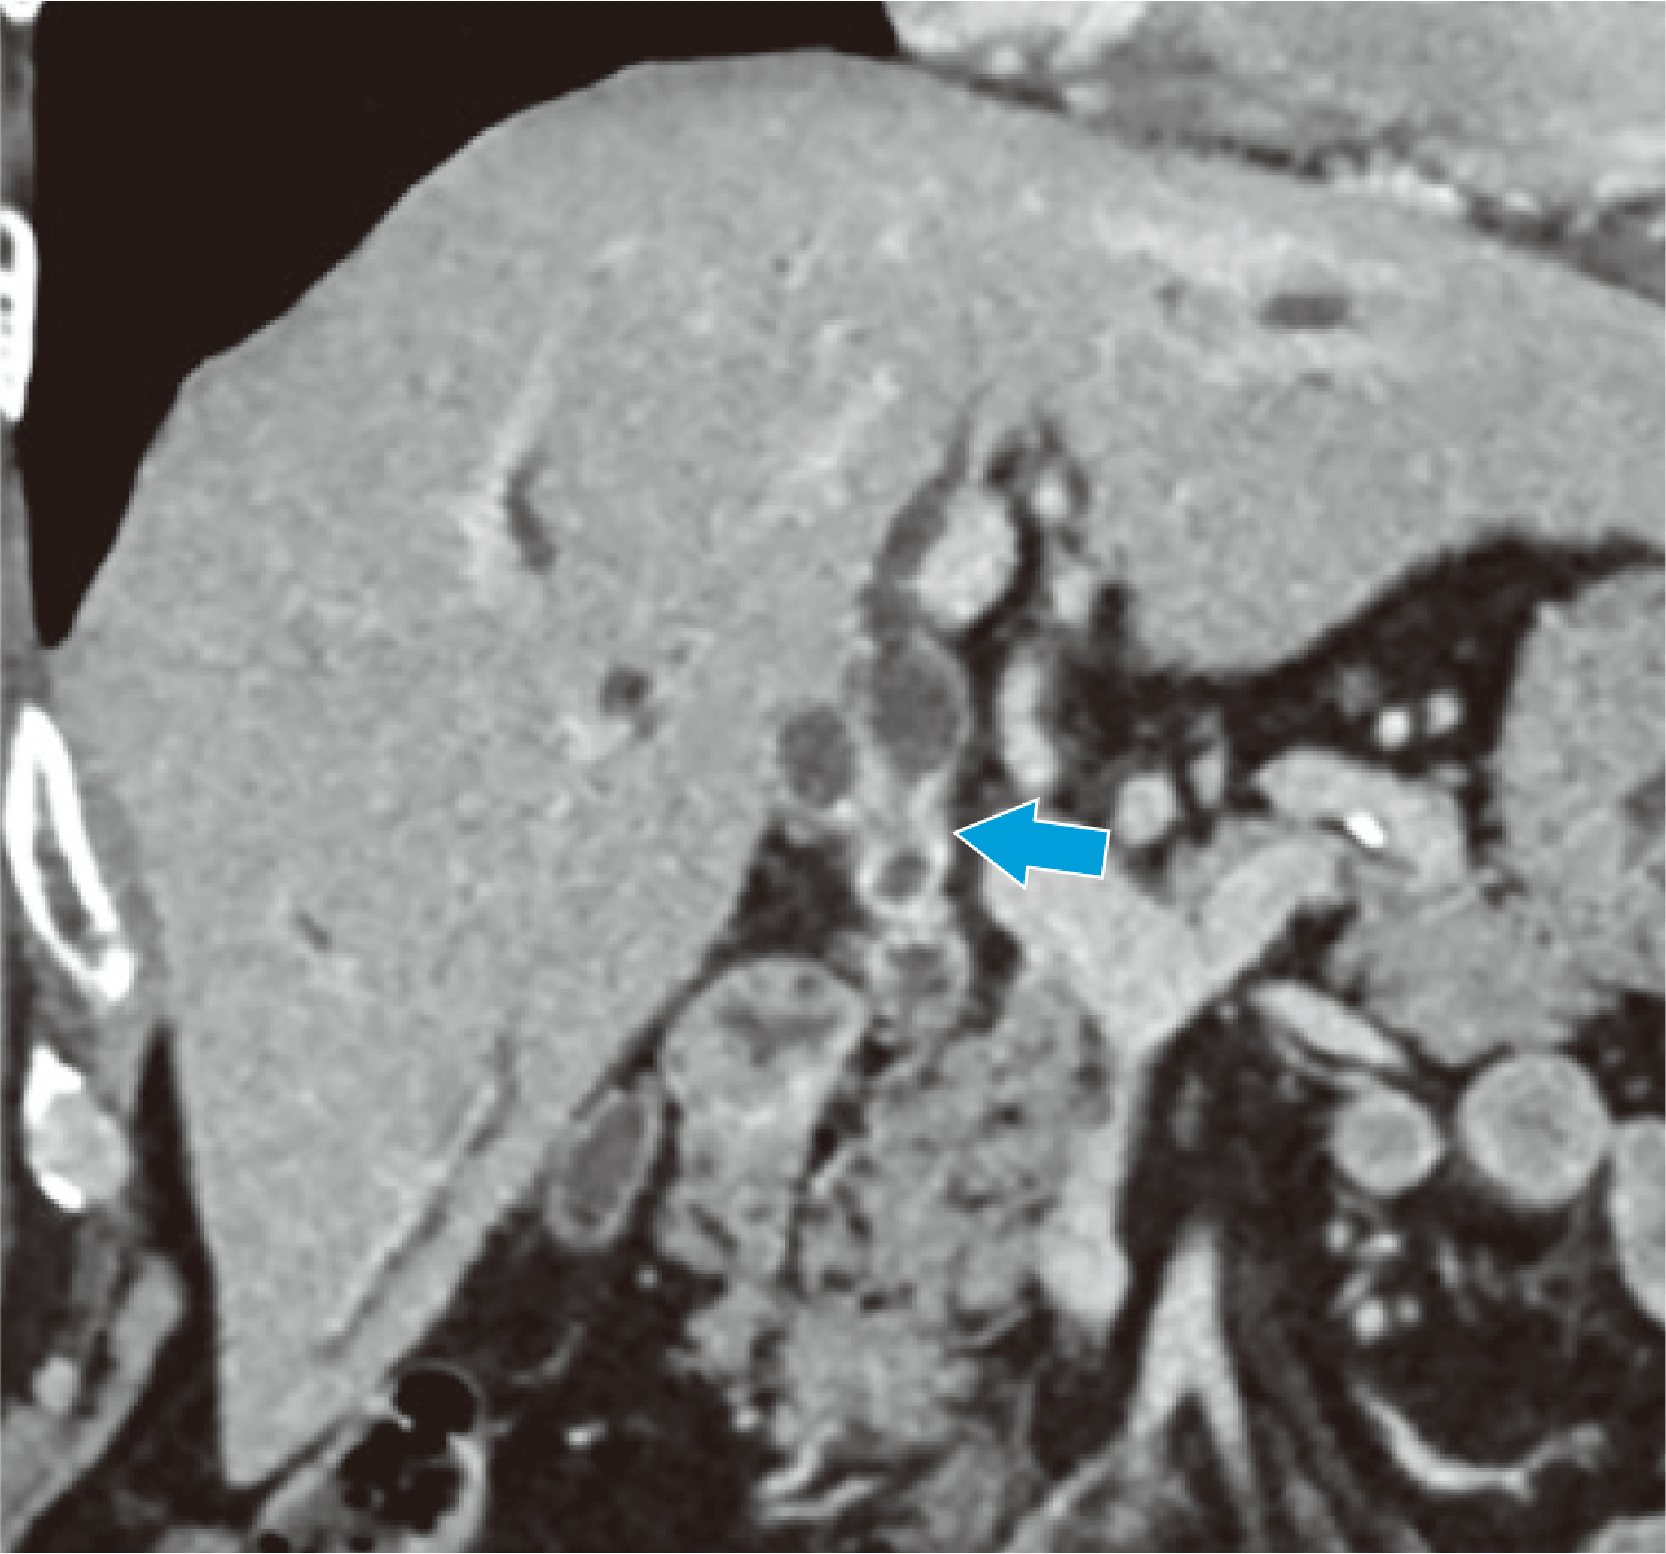
Full-circumference bile duct wall thickening can be seen, centered on the perihilar bile duct (➡), and as the right and left hepatic ducts have been pulled apart they have expanded.
Fig. 3. Coronal section in the equilibrium phase (tumor central region)
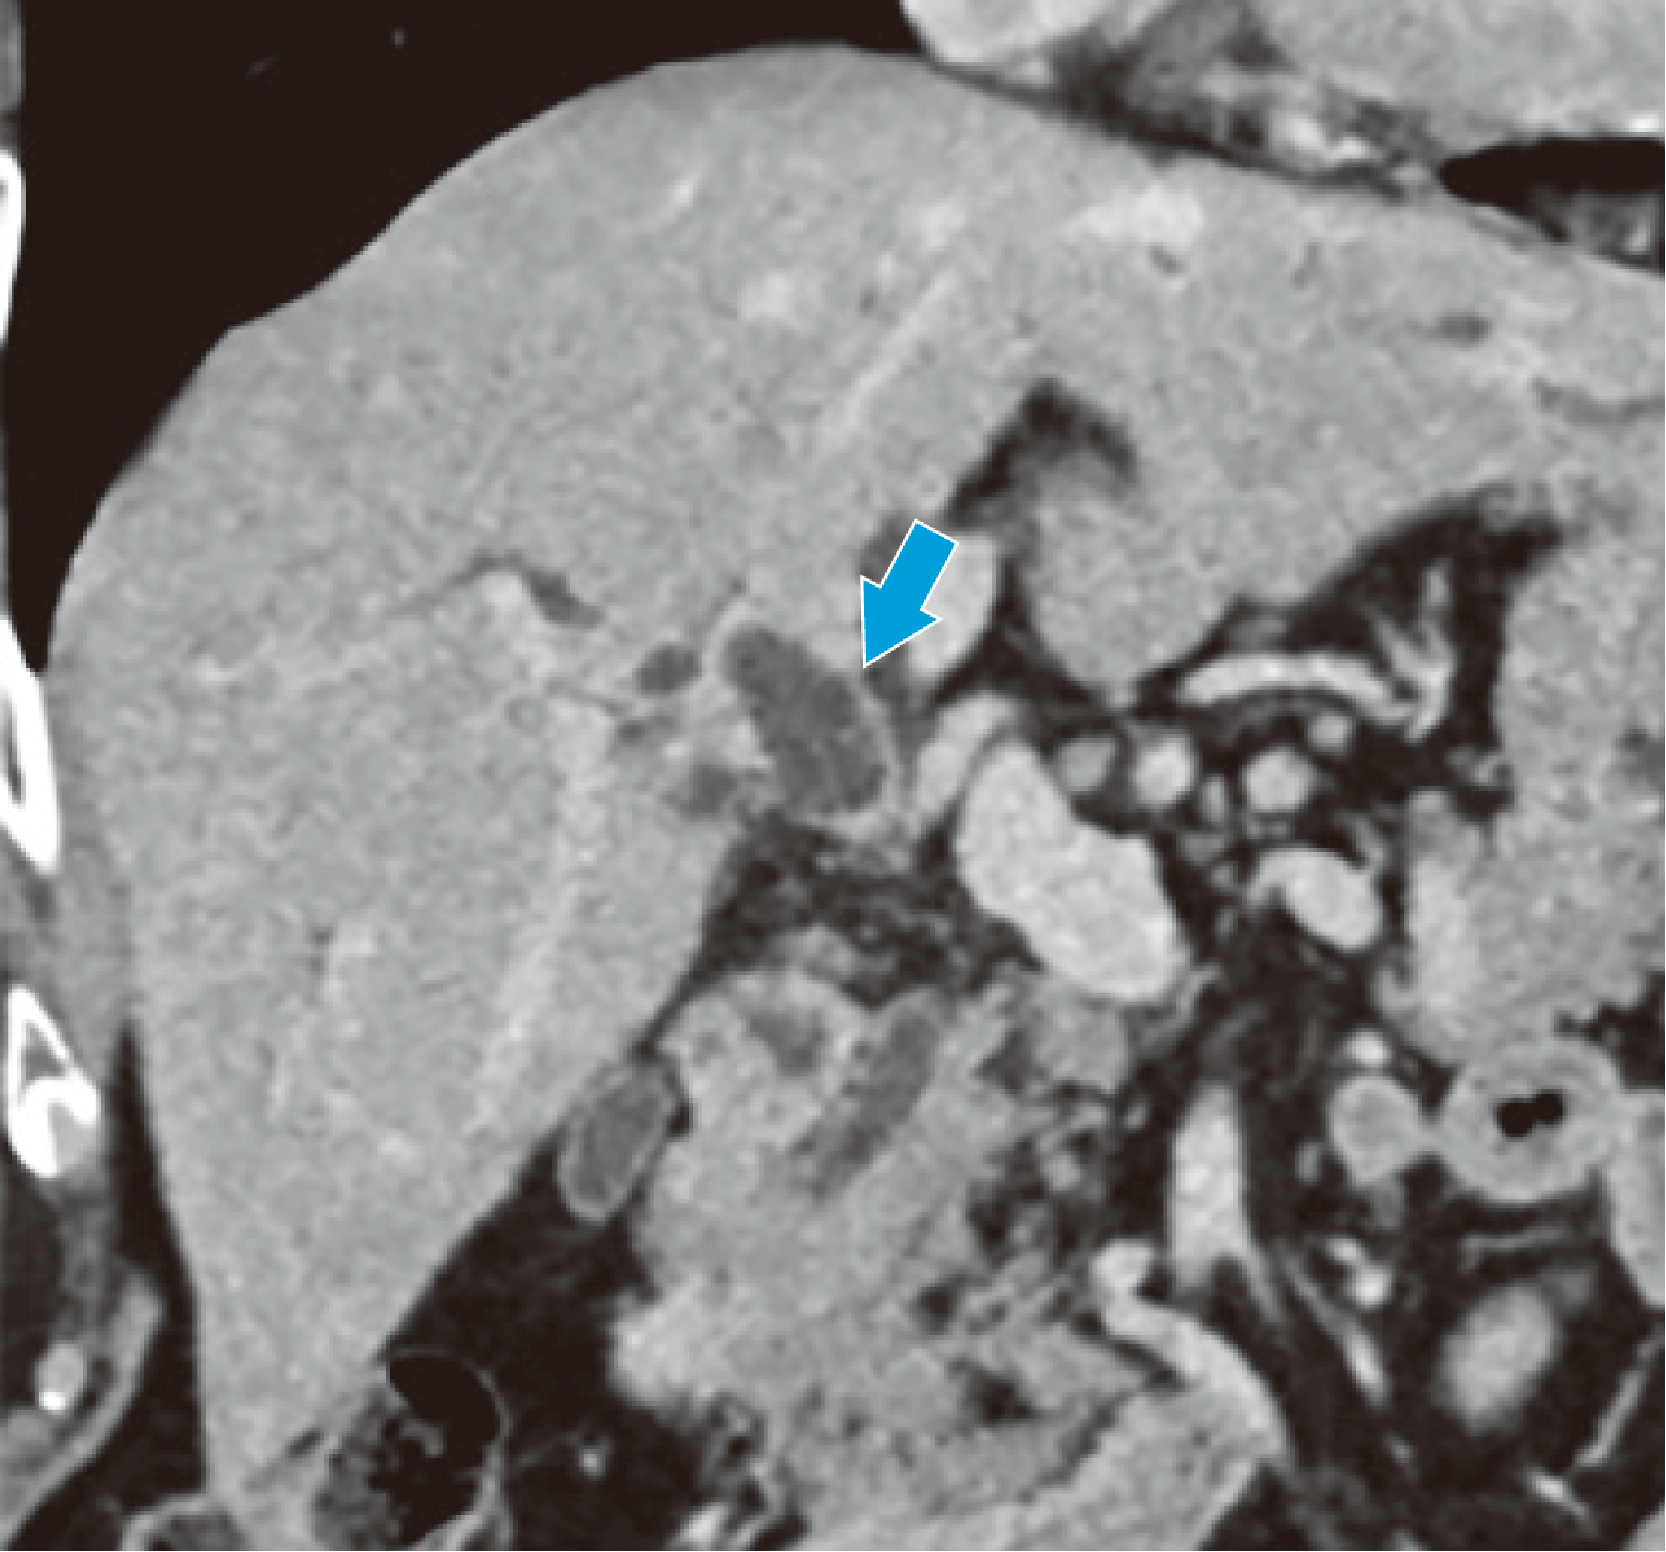
Wall thickening in the right hepatic duct has not reached the anteroposterior bile duct (➡).
Fig. 4. Coronal section in the equilibrium phase (extent of progression in the right hepatic duct)
Wall thickening in the left hepatic duct has not reached the right margin of the portal vein umbilical region (➡).
Fig. 5. Coronal section in the equilibrium phase (extent of progression in the left hepatic duct)
Wall thickening in the common bile duct has reached the upper margin of the pancreas (➡).
Wall thickening is continuous, even in the proximal region of the cystic duct (➤).
Fig. 6. Coronal section in the equilibrium phase (extent of progression on the duodenal side)
Photography protocol
| Equipment used | CT device model | Revolution CT True Fidelity (version 2.0) with GSI Xtream (GE Healthcare Japan) |
| Number of CT detector rows / number of slices | 256 rows | |
| Workstation | AW Server (GE Healthcare Japan) and Vincent (Fujifilm Medical) |
| Automatic injector model and manufacturer | Dual Shot GX7 (Nemoto Kyorindo) | Indwelling needle size (G) | 20G |
| Contrast agent name and concentration | Iopromide 370 injection syringe | Injection pressure limit | 13kg/cm2 |
| Contrast agent dose | 600mgI/kg | Physiological saline solution dose | 40mL | Scan timing | BT method (celiac artery), 80HU |
| Contrast agent injection time | 30sec | Physiological saline solution injection speed | Same as contrast agent injection speed | Delay time | See table below |
| Imaging conditions | Imaging phase | Early arterial phase | Late arterial phase | Early portal phase | Portal phase | Equilibrium phase | Simple |
| Tube voltage (kV) | GSI 80-140 | GSI 80-140 | GSI 80-140 | GSI 80-140 | GSI 80-140 | 100 | |
| AEC | GSI Assist 14.8 | GSI Assist 14.8 | GSI Assist 14.8 | GSI Assist 14.8 | GSI Assist 14.8 | Smart mA 14.8 | |
| Beamwidth (mm) | 80 | 80 | 80 | 80 | 80 | 80 | |
| Slice thickness (mm) | 2.5 | 2.5 | 2.5 | 2.5 | 2.5 | 2.5 | |
| Focal-spot size | Large | Large | Large | Large | Large | Large | |
| Scan mode | Helical | Helical | Helical | Helical | Helical | Helical | |
| Scan speed (s/rotation) | 0.8 | 0.8 | 0.8 | 0.8 | 0.8 | 0.6 | |
| Pitch | 0.992 | 0.992 | 0.992 | 0.992 | 0.992 | 0.992 | |
| Scan range | Upper abdomen | Upper abdomen | Upper abdomen | Upper abdomen to pelvis | Upper abdomen | Upper abdomen | |
| Imaging duration (s) | 4.65 | 4.65 | 4.65 | 5.15 | 4.65 | 3.11 | |
| Imaging direction | Head to foot | Head to foot | Head to foot | Head to foot | Head to foot | Head to foot |
| Reconstruction conditions | Early arterial phase | Late arterial phase | Early portal phase | Portal phase | Equilibrium phase | Simple | |
| Routine: Reconstructed slice thickness / interval (mm/mm) | 2.5/2.5 | 2.5/2.5 | 2.5/2.5 | 2.5/2.5 | 2.5/2.5 | ー | |
| Routine: Reconstruction function / iterative approximation method | Stnd/DL IR-M | Stnd/DL IR-M | Stnd/DL IR-M | Stnd/DL IR-M | Stnd/DL IR-M | ー | |
| 3D / multiplanar reformation: Reconstructed slice thickness / interval (mm/mm) | 3.0/3.0 | 3.0/3.0 | 3.0/3.0 | 3.0/3.0 | 3.0/3.0 | ー | |
| 3D / multiplanar reformation: Reconstruction function / iterative approximation method | Stnd/DLI R-M | Stnd/DLI R-M | Stnd/DLI R-M | Stnd/DLI R-M | Stnd/DLI R-M | ー |
| Contrast conditions | Early arterial phase | Late arterial phase | Early portal phase | Portal phase | Equilibrium phase | Simple | |
| Delay time (s) | 10 | 10 | 10 | 10 | 100 | ー |
Precautions for use (excerpt)
5. Administration to elderly people
This drug is excreted primarily by the kidneys, but in elderly patients renal function is often depressed, so high blood concentrations may persist. Therefore, it should be administered carefully, at the minimum essential dose, while monitoring the patient's condition.
- *The case introduced is just one clinical case, so the results are not the same as for all cases.
- *Please refer to the Package Insert for the effects and indications, dosage and administration method, and warnings, contraindications, and other precautions with use.
