

Monitoring of nonhypervolemic lesions
Iwate Medical University Hospital
Dr. Akio Tamura, Dept. of Radiology
Dr. Shun Abe, Division of Central Radiology
DATE : 2021
Introduction

Patient’s background
Female; 60s; body weight: 77 kg; nonalcoholic fatty liver disease; hepatocellular carcinoma (HCC)
Assessment objectives
EOB-MRI was performed before surgery for HCC in S8 of the liver, and in the hepatobiliary phase a low-signal nodule was found in S4. Partial resection of S8 of the liver was performed, followed by periodic EOB-MRI as monitoring.
Contrast agent used
Gadoxetate disodium(Gd-EOB-DTPA) injection, 0.1 mL/kg
Case explanation
The lesion in S4 of the liver expanded during the clinical course, and MRI after 26 months showed wash-out in the portal phase, but no dark staining in the early phase. After 46 months, dark staining was shown in the early phase, and T2-weighted imaging also showed a faint high-signal lesion.
Due to the definite signs of HCC, radiofrequency ablation was performed. Multiple lesions were found in the liver during monitoring, including similar nonhypervolemic lesions and lesions associated with typical early-phase dark staining.
Imaging findings
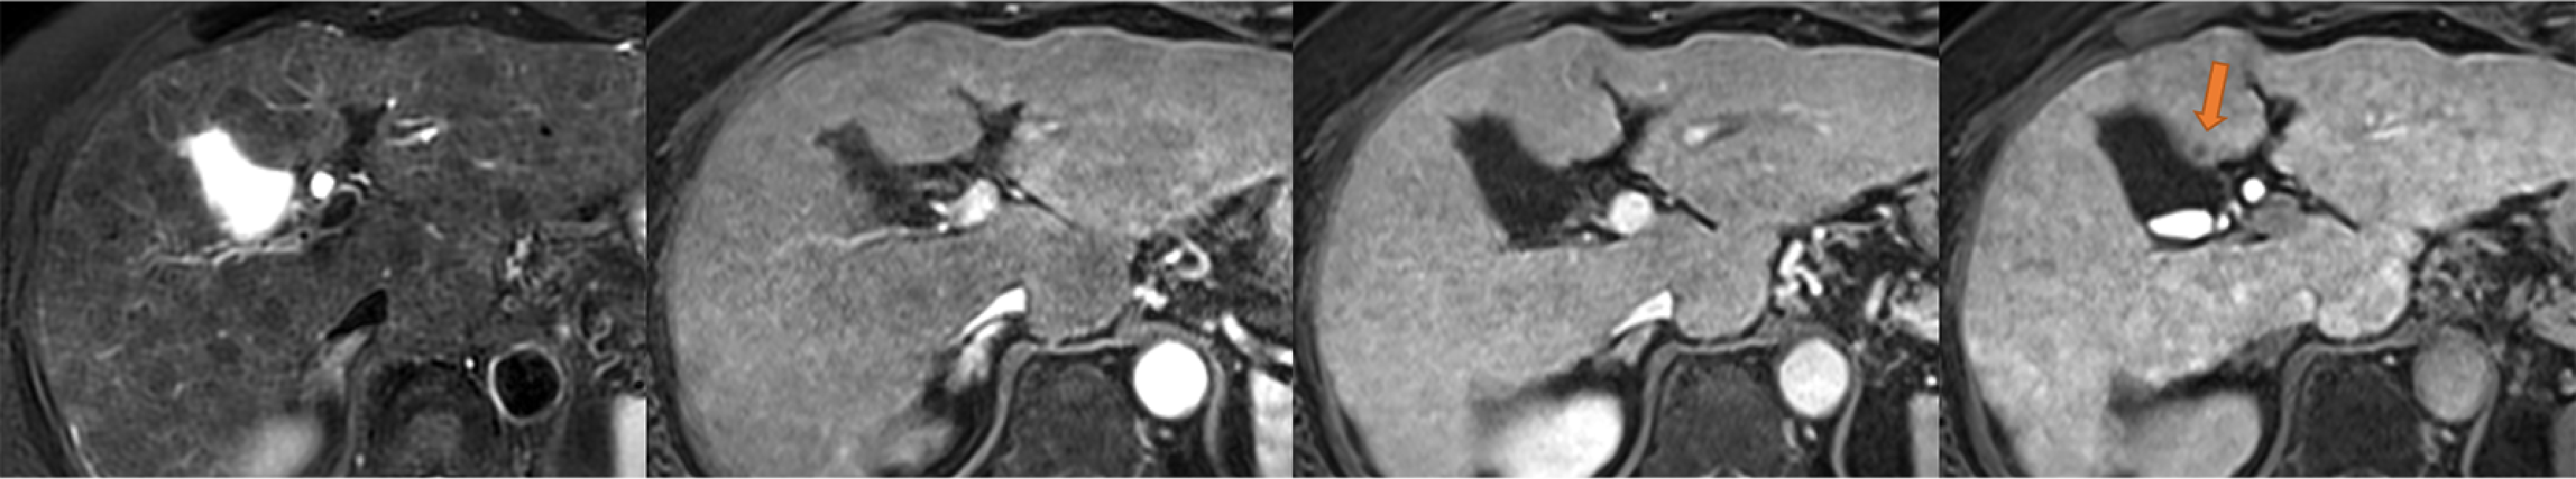
A small, low-signal nodule was found in S4 of the liver in the hepatobiliary phase (arrow).
Dark staining in the early phase and wash-out were not found, and the signs with T2-weighted imaging were not clear.
Regenerative nodules were occasionally seen in the background.
Fig. 1. EOB-MRI at initial examination (from left to right: fat-suppressed T2-weighted imaging; arterial phase; portal phase; hepatobiliary phase)
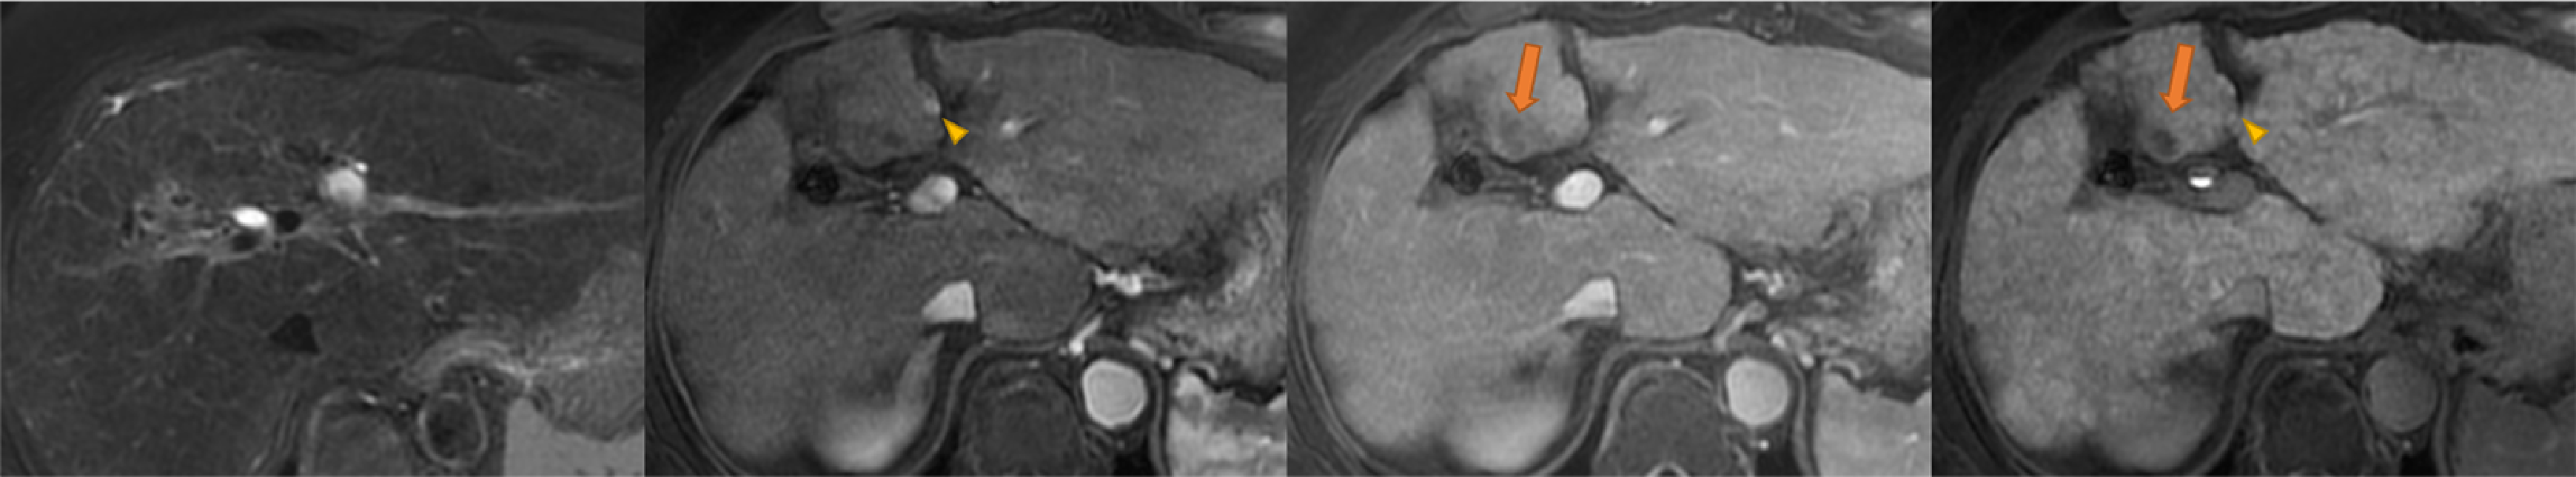
One lesion in S4 of the liver was found to have expanded, and wash-out could now be seen in the portal phase (arrow).
Early-phase dark staining was not clear, and even T2-weighted imaging showed an isosignal with the surrounding liver parenchyma.
Similarly, a low signal in S4 of the liver was shown in the hepatobiliary phase, and a lesion associated with early-phase dark staining was found (arrowhead).
Fig. 2. EOB-MRI after 26 months (from left to right: fat-suppressed T2-weighted imaging; arterial phase; portal phase; hepatobiliary phase)
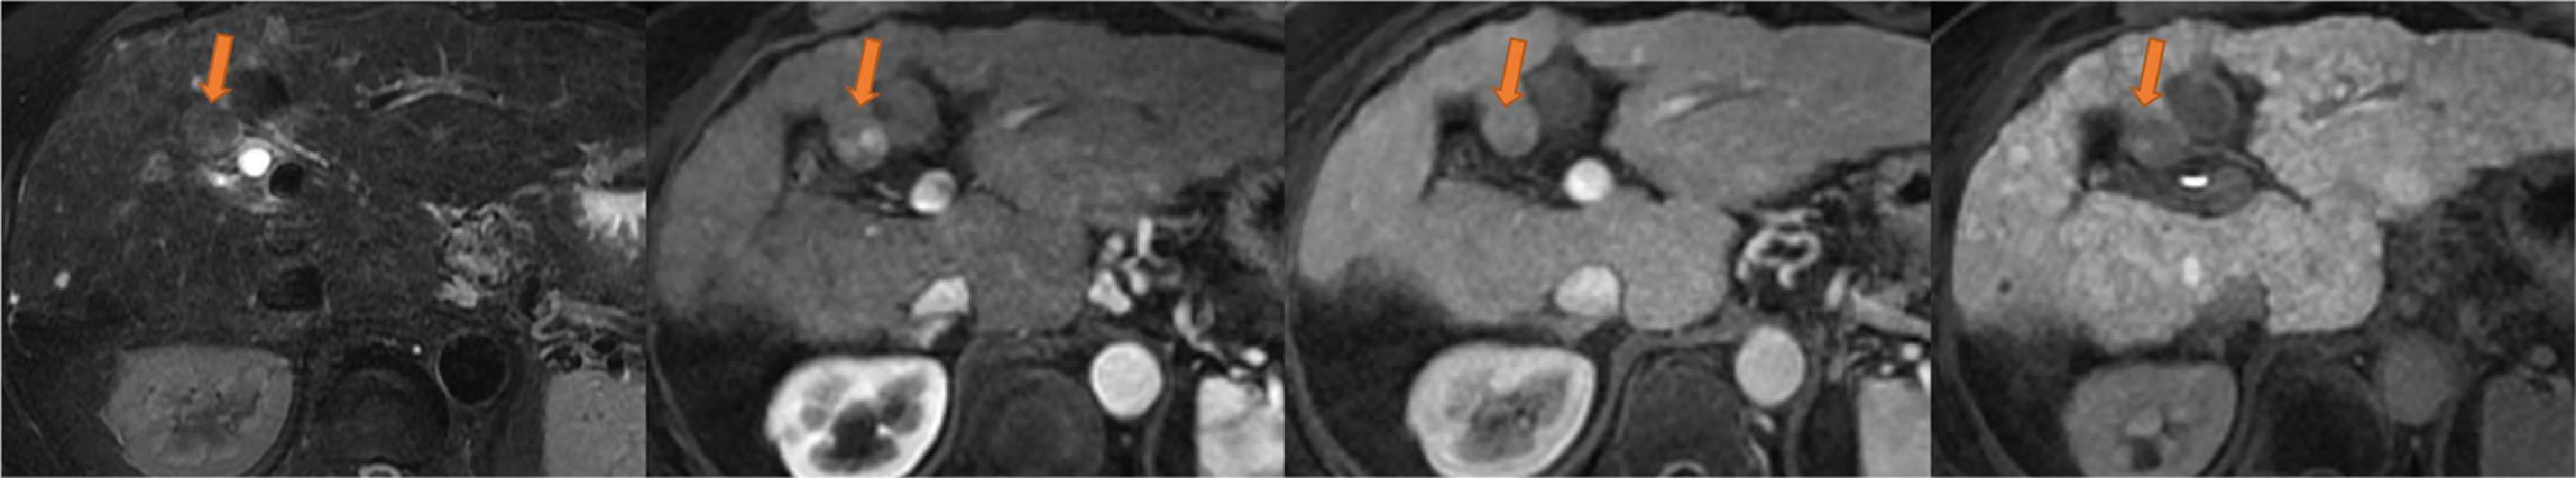
Together with swelling-type expansion of the lesion in S4, nodule-in-nodule-type dark staining was found in the lesion interior in the early phase, and a high-signal region was found with T2-weighted imaging (arrow).
Fig. 3. EOB-MRI after 46 months (from left to right: fat-suppressed T2-weighted imaging; arterial phase; portal phase; hepatobiliary phase)
Photography protocol
| Imaging type | Photography sequence | Photography duration (min:s) | TE (msec) | TR (msec) | FA (deg) | Fat sat (type) | ETL (number) | P-MRI (Reduction Factor) | Holding breath (yes/no) |
| Dual echo | 3D-GRE(LAVA) | 20 | Minimum (1.1 2.2) | 5.0 | 60 | ー | ー | 2.0 | Yes |
| Contrast agent administration | |||||||||
| Dynamic | 3D-GRE(LAVA) | 20 | 2.0 | 4.6 | 12 | Chem SAT (Special) | ー | 2.0 | Yes |
| DWI | EPI | 1:48 | Minimum (74.6) | effective TR (4000~7000) | ー | Chem SAT (Special) | ー | 2.0 | No |
| T2WI | PROPELLER | 3:28 | 91.7 | effective TR (4000~7000) | 140 | Chem SAT (Fat) | 28 | ー | No |
| Hepatobiliary phase | 3D-GRE(LAVA) | 18 | 1.9 | 4.1 | 12 | Chem SAT (Special) | ー | 2.0 | Yes |
| Hepatobiliary phase Cor | 3D-GRE(LAVA) | 18 | 1.9 | 4.1 | 12 | Chem SAT (Special) | ー | 2.0 | Yes |
| Imaging type | NEX (calculation number) | k-space | In-plane resolution (mm) | Slice thickness (mm) | FOV (mm) | Rectangu-lar FOV(%) | Phase direction (step number) | Read direction (matrix number) | Slice Gap (mm) | Slice number |
| Dual echo | 1.0 | sequential | 1.3×1.5 | 4.0 | 380 | 80 | 256 | 288 | 2.0 | 50 |
| Contrast agent administration | ||||||||||
| Dynamic | 1.0 | sequential | 1.3×1.5 | 4.0 | 380 | 80 | 256 | 288 | ー | 50 (using ZIP) |
| DWI | 2.0 | sequential | 2.7×2.4 | 8.0 | 380 | 100 | 160 | 140 | 2.0 | 20 |
| T2WI | 1.0 | radial | 1.3×1.3 | 8.0 | 380 | ー | 288 | 288 | 2.0 | 20 |
| Hepatobiliary phase | 1.0 | sequential | 1.3×1.5 | 4.0 | 380 | 80 | 256 | 288 | ー | 50 (using ZIP) |
| Hepatobiliary phase Cor | 1.0 | sequential | 1.3×1.5 | 4.0 | 380 | 80 | 256 | 288 | ー | 50 (using ZIP) |
Devices used and contrast conditions
| MRI device | Signa Architect |
| Automatic injection device | Sonic Shot 7 |
| Workstation | ー |
| Contrast conditions | Dose (mL) | Administration rate (mL/s) | Photography timing | |
| Gadoxetate disodium(Gd-EOB-DTPA) | 0.1mL/kg | 10-s injection | Initiation when the contrast agent reached the left ventricle (approximately 30 s, approximately 70 s, and approximately 135 s) | |
| Physiological saline solution for flushing | 30mL | Same speed as contrast agent |
Usefulness of Gadoxetate disodium(Gd-EOB-DTPA) contrast MRI with this patient
Lesions that show low signals in the hepatobiliary phase of EOB-MRI without dark staining in the early phase include advanced liver cancer, early-stage liver cancer, high-grade dysplastic nodules, low-grade dysplastic nodules, and regenerative nodules(1). It is known that most nonhypervolemic lesions gradually become hypervolemic, over a period of a year or more, and EOB-MRI is a modality that could be used to examine this change(2). In addition, although the time-point at which treatment of nonhypervolemic lesions is initiated appears to differ between institutions, at least during monitoring EOB-MRI is considered to be indispensable for clear detection of HCC, which is the target for treatment.
- Joo I, et al. Radiologic-Pathologic Correlation of Hepatobiliary Phase Hypointense Nodules without Arterial Phase Hyperenhancement at Gadoxetic Acid-enhanced MRI: A Multicenter Study. Radiology. 2020 Aug;296(2):335-345.
- Suh CH, et al. Hypervascular Transformation of Hypovascular Hypointense Nodules in the Hepatobiliary Phase of Gadoxetic Acid-Enhanced MRI: A Systematic Review and Meta-Analysis. AJR Am J Roentgenol. 2017 Oct;209(4):781-789.
- *The case introduced is just one clinical case, so the results are not the same as for all cases.
- *Please refer to the Package Insert for the effects and indications, dosage and administration method, and warnings, contraindications, and other precautions with use.
