

One case of EOB-MRI being useful for subtype diagnosis of hepatocellular adenoma
Iwate Medical University Hospital
Dr. Akio Tamura, Dept. of Radiology
Dr. Shun Abe, Division of Central Radiology
DATE : 2021
Introduction

Patient’s background
Female; 20s; hepatocellular adenoma
Assessment objectives
A mass was detected in S7 of the liver by ultrasonography during intensive, multiphasic health screening, and the patient was referred to the authors’ hospital. An abnormally high PIVKA-II value was found, and hepatocellular carcinoma (HCC) was suspected, so dynamic computed tomography (CT) was performed, but the lesion found was an atypical mass with poor contrast enhancement. EOB-MRI was then performed as a thorough examination. The patient had no history of using oral contraceptives, and no other significant medical history.
Contrast agent used
Gadoxetate disodium(Gd-EOB-DTPA) injection, 0.1 mL/kg
Case explanation
On the basis of the results of EOB-MRI, this patient was suspected of having β-catenin-activated hepatocellular adenoma, but focal nodular hyperplasia was put forward as another possibility requiring differentiation. Laparoscopic partial hepatectomy was performed, and the pathological diagnosis was β-catenin-activated hepatocellular adenoma, as with diagnostic imaging. After surgery, the PIVKA-II level underwent normalization.
Imaging findings
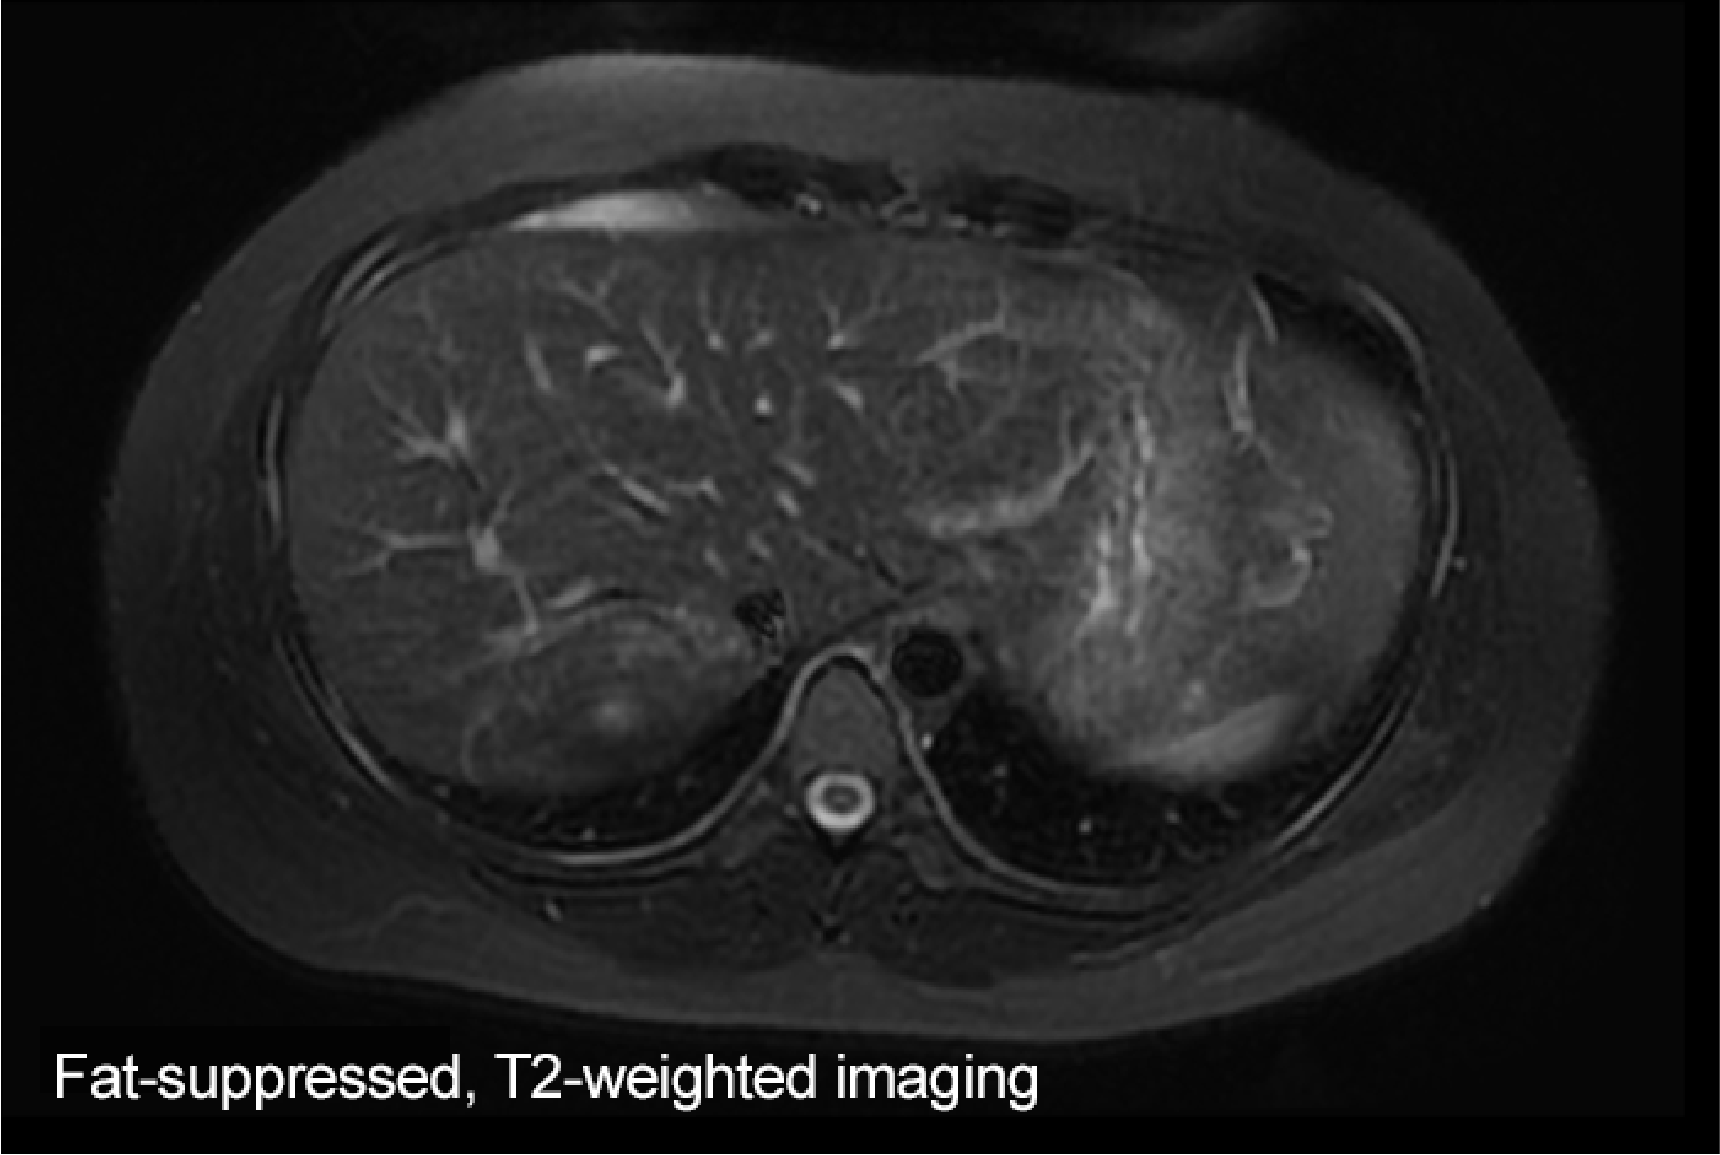
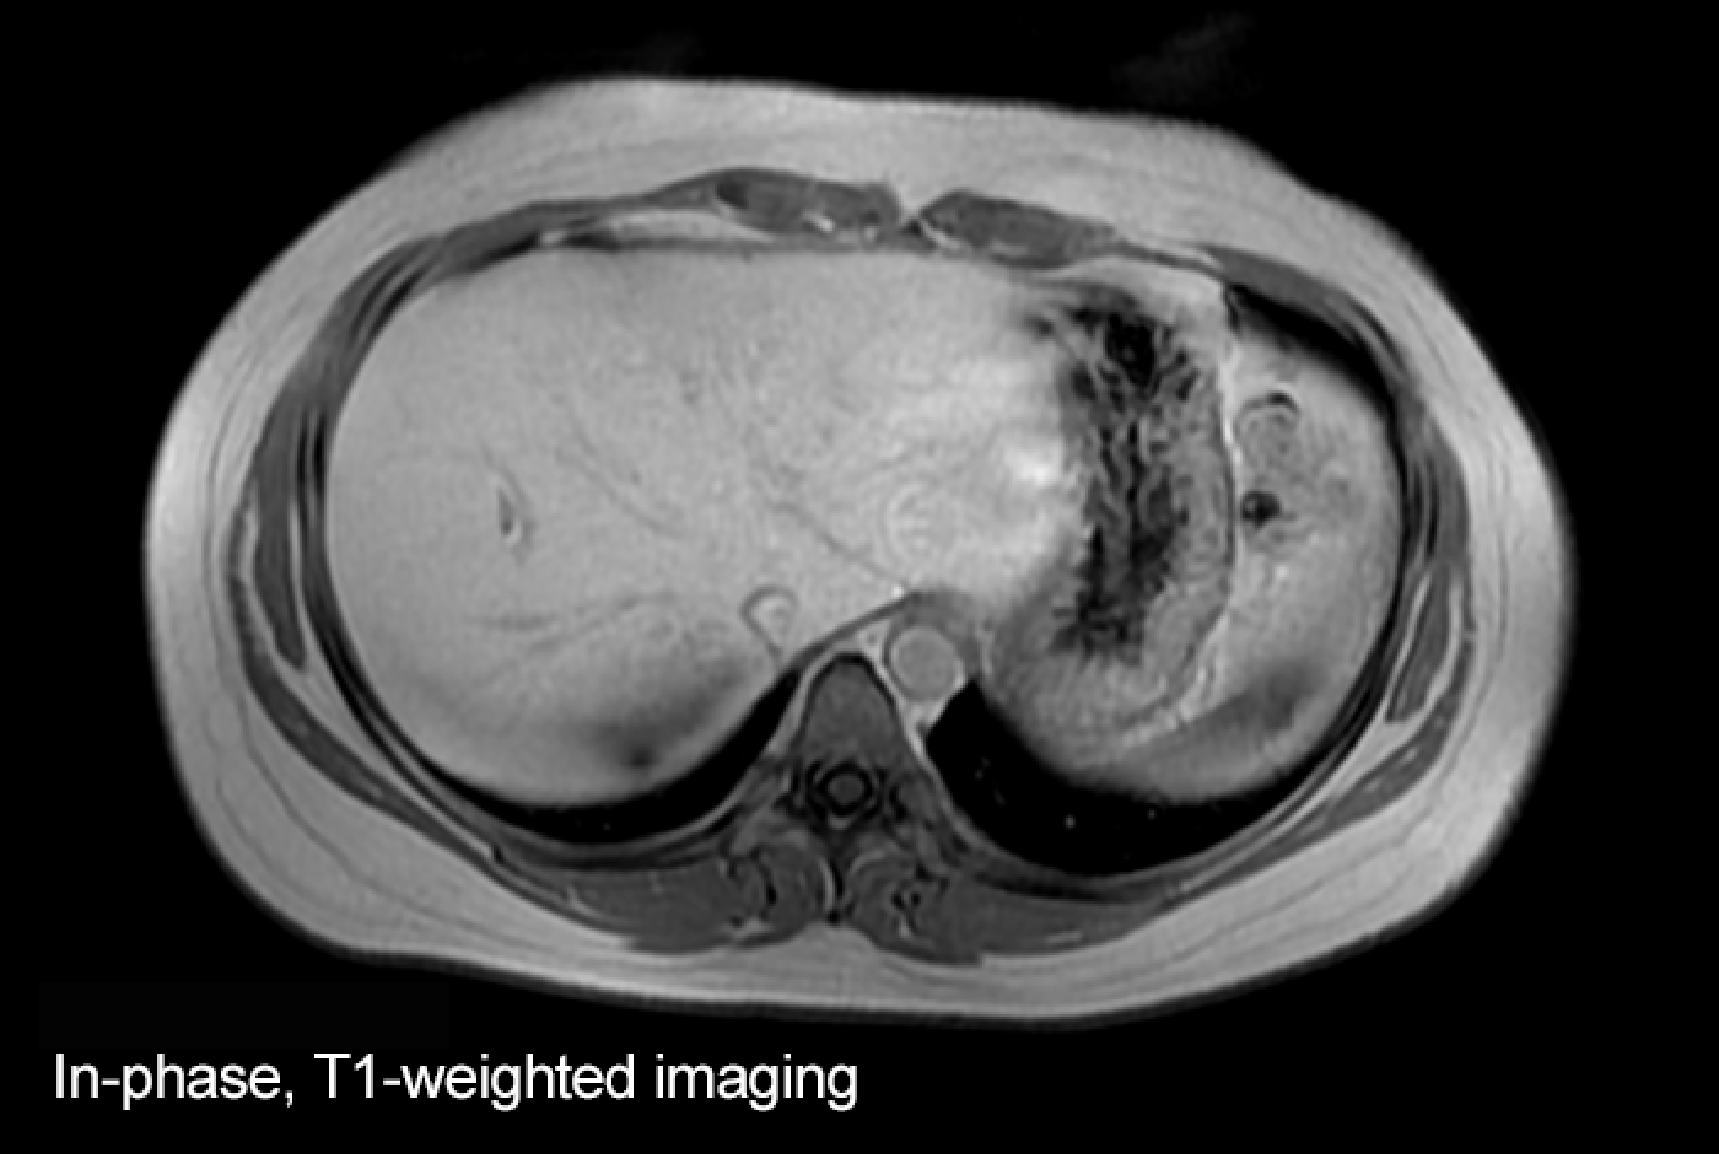

A mass was found in S7 of the liver. With fat-suppressed, T2-weighted imaging, it showed an isosignal with the surrounding hepatic parenchyma, and with T1-weighted, in-phase imaging, it showed a somewhat lower signal than to an isosignal with the surrounding hepatic parenchyma.
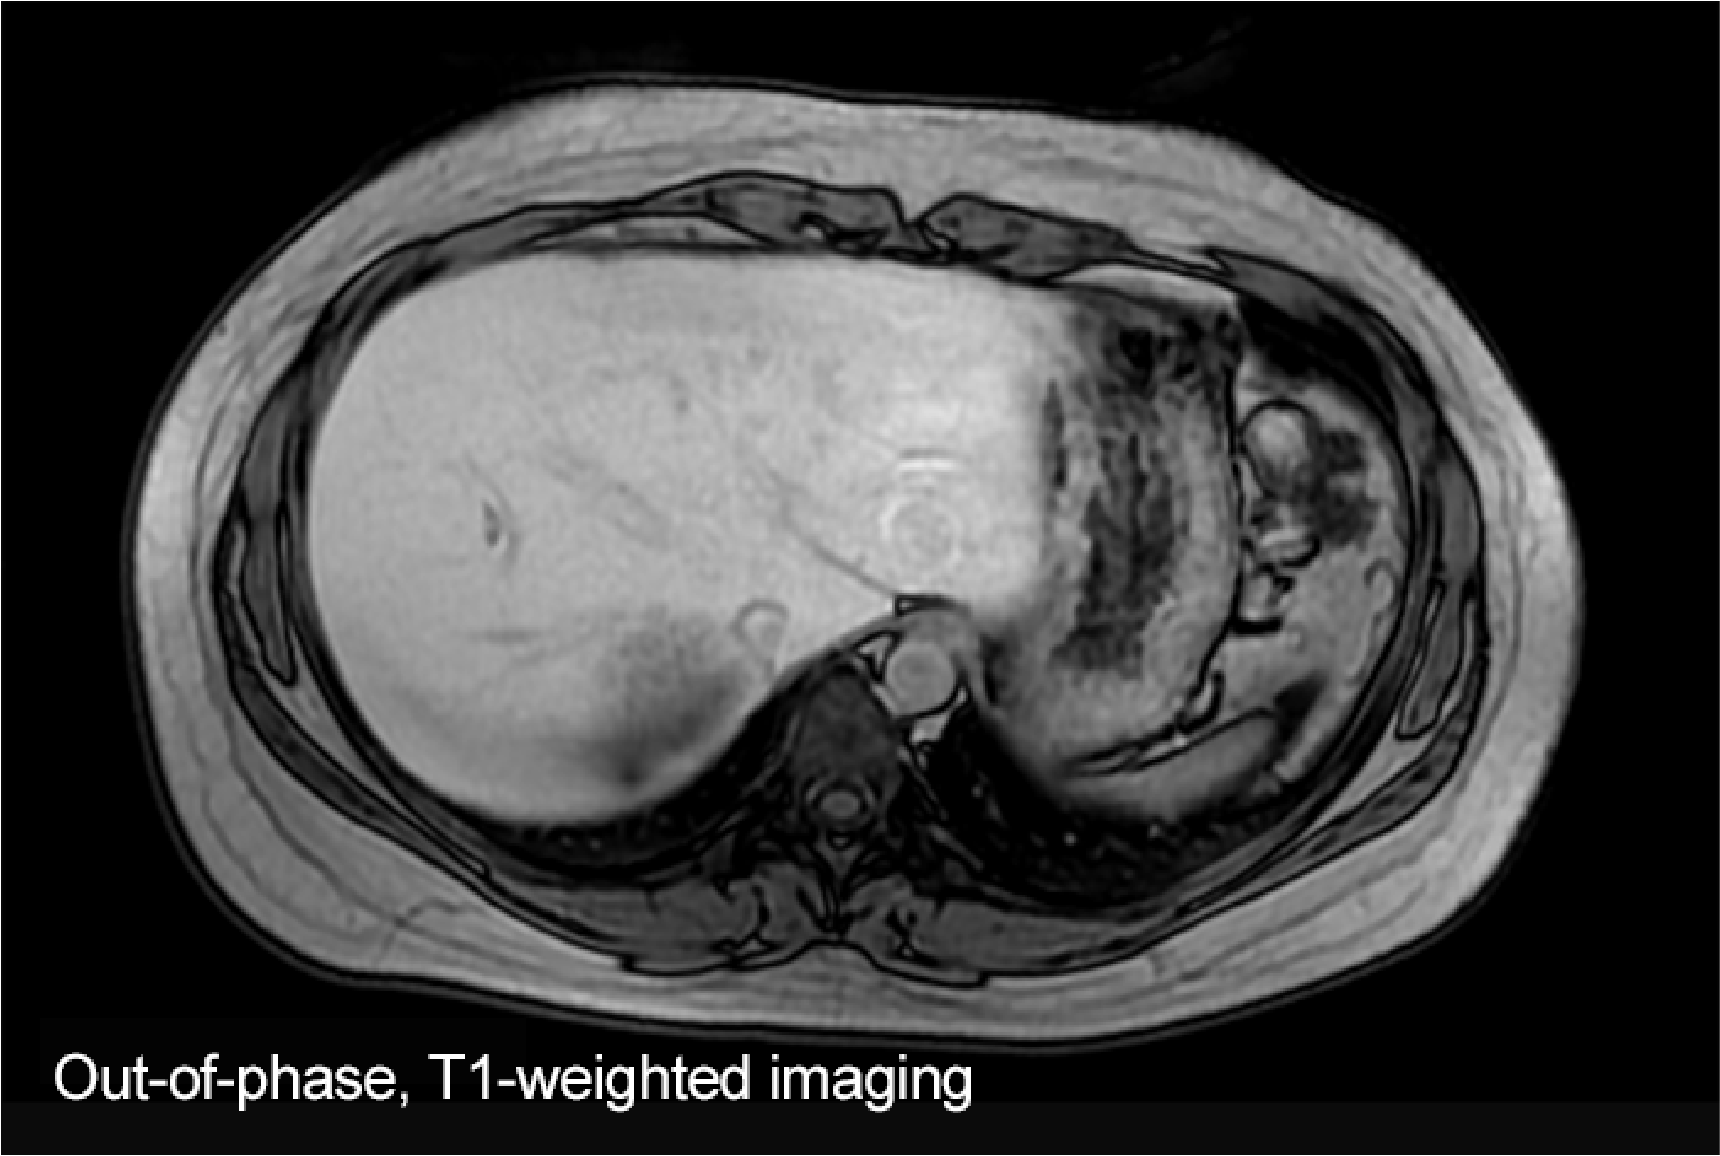
The out-of-phase signal was lower than the in-phase signal with T1-weighted imaging, suggesting fat deposition.
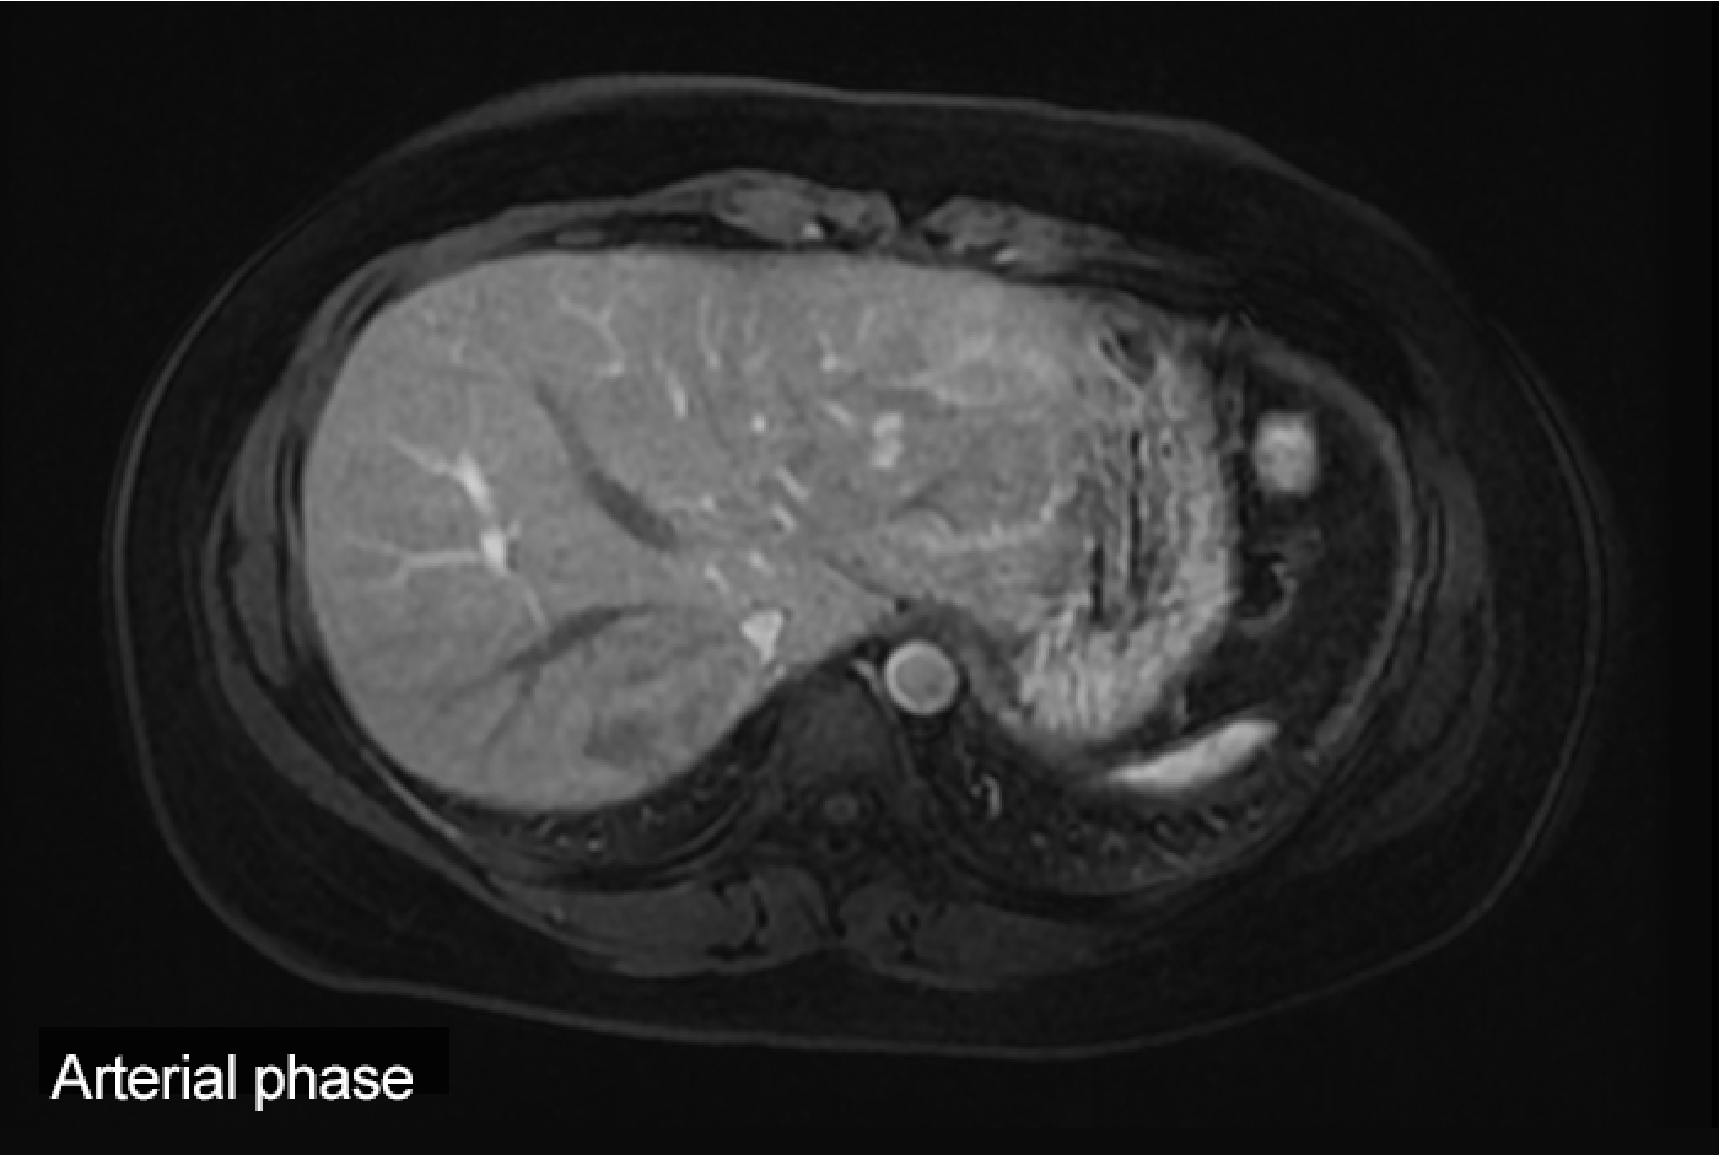
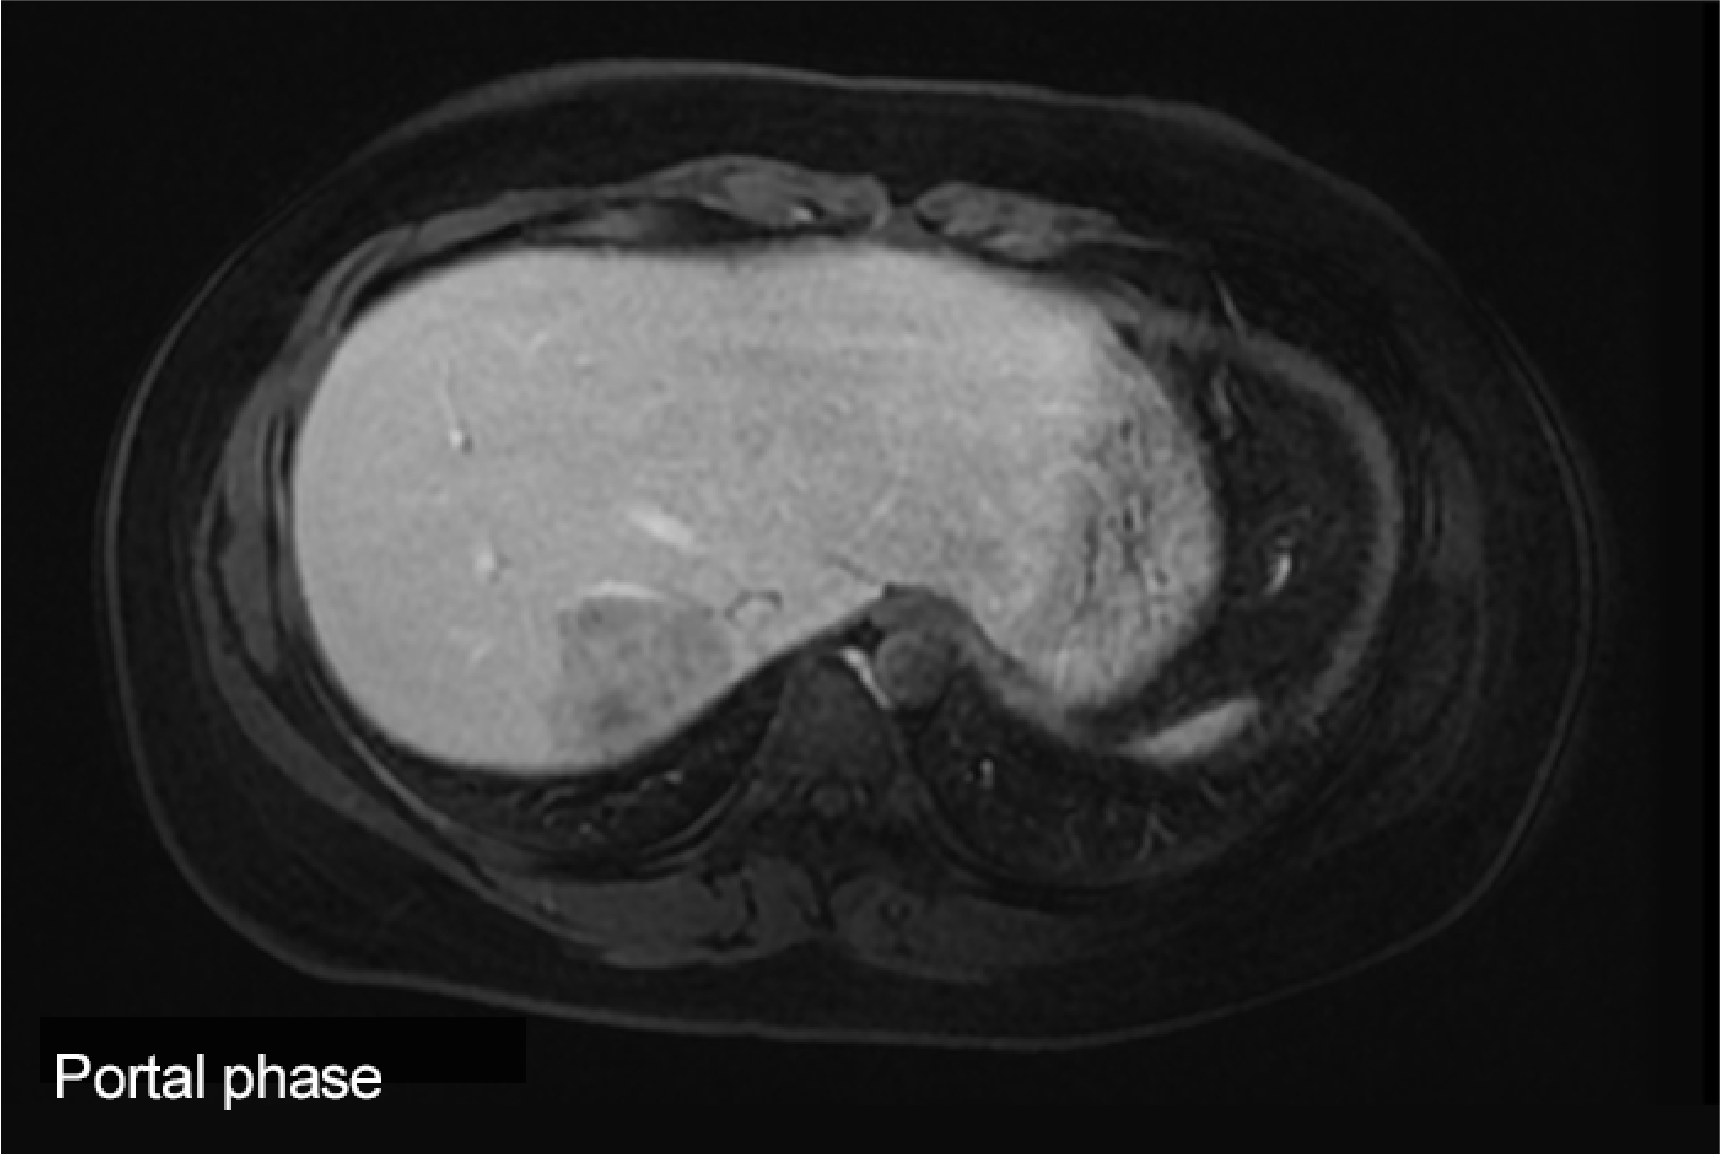
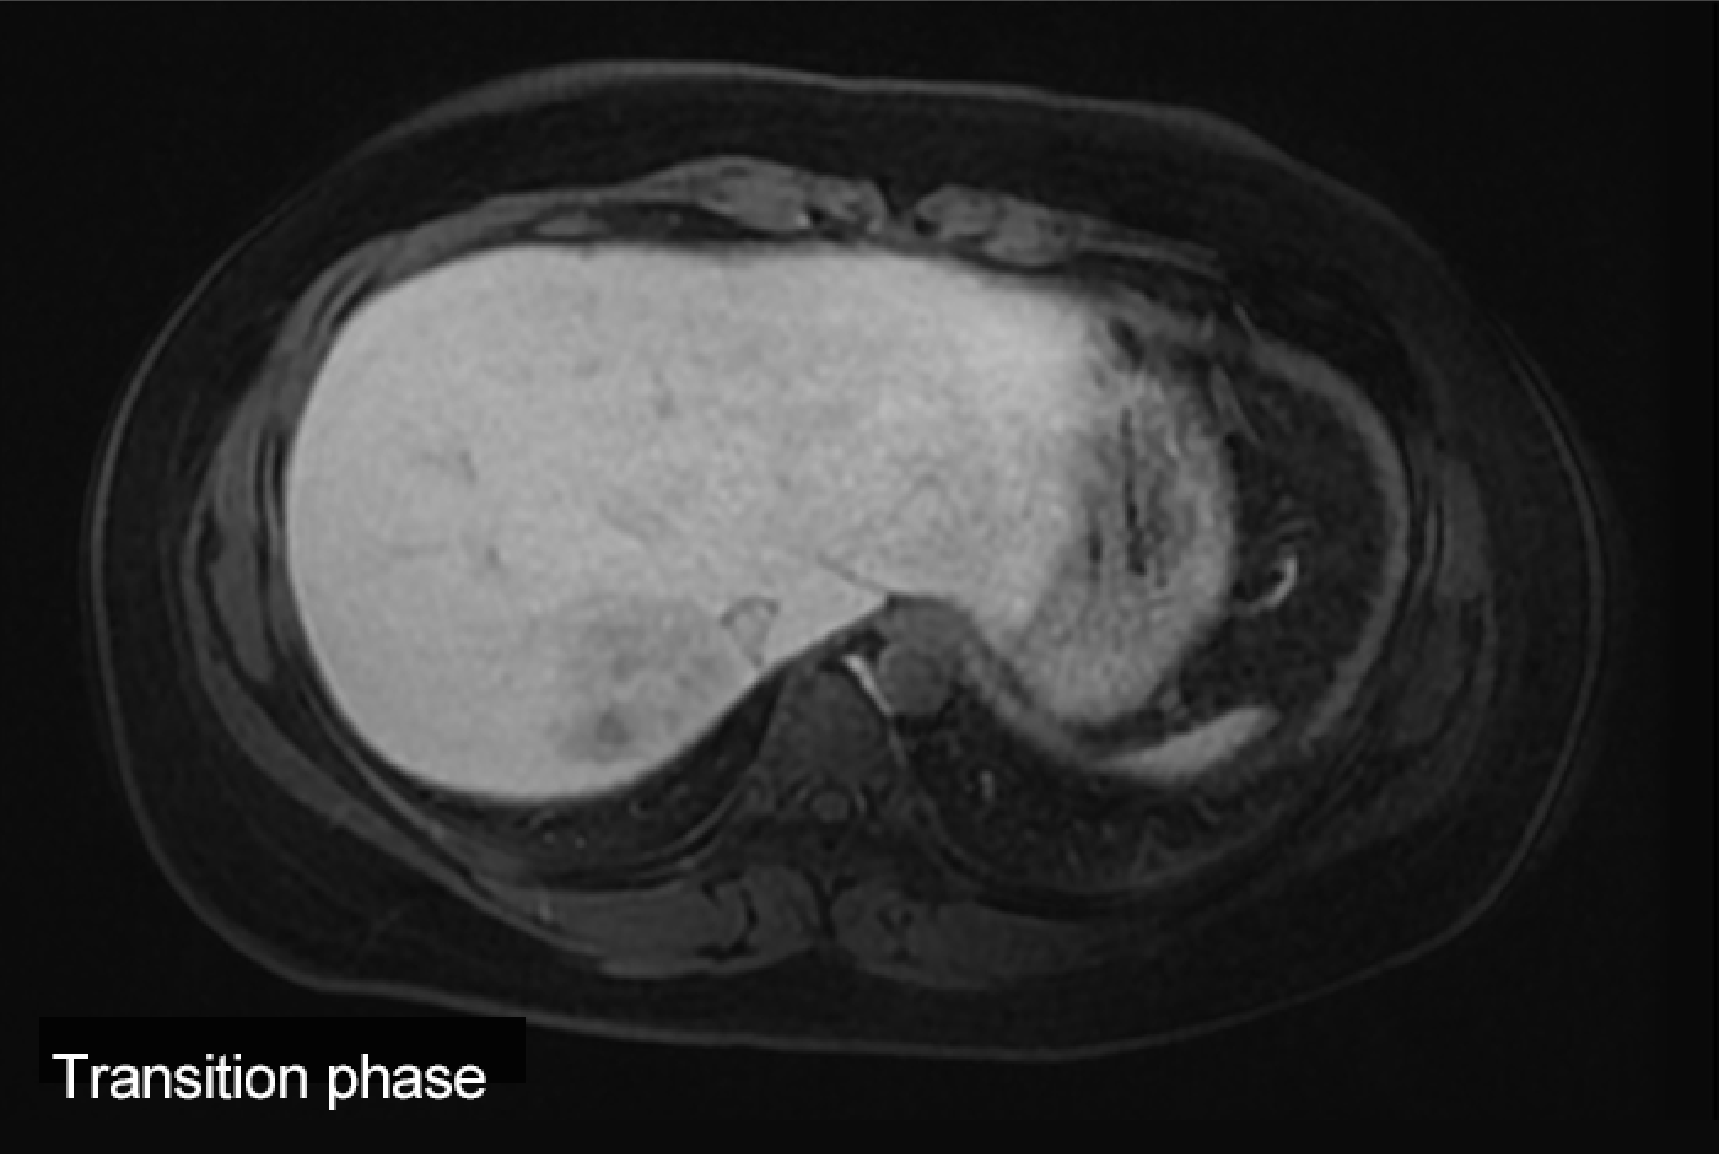
EOB-MRI did not show clear dark staining in the arterial phase, but it showed low signals in the portal and transition phases, and from an isosignal to a high signal in the hepatobiliary phase.
Fig. 1. Initial EOB-MRI image
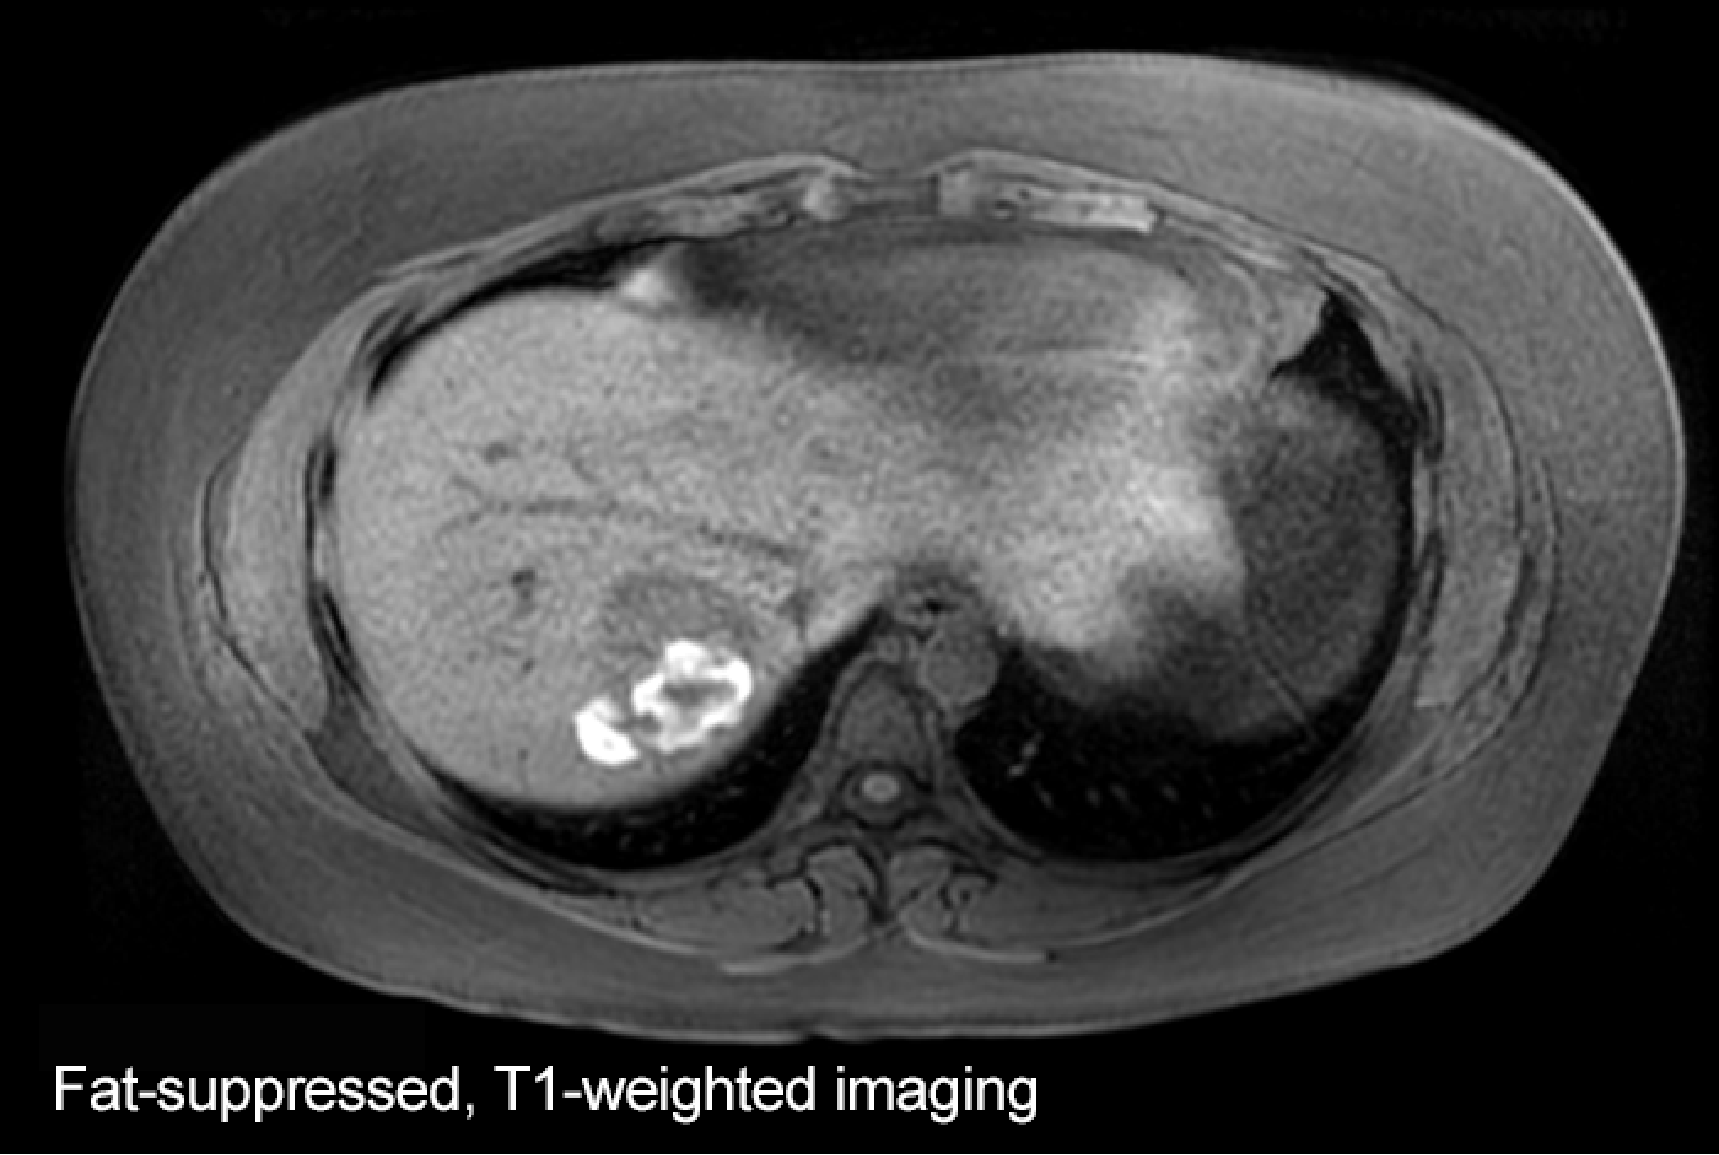
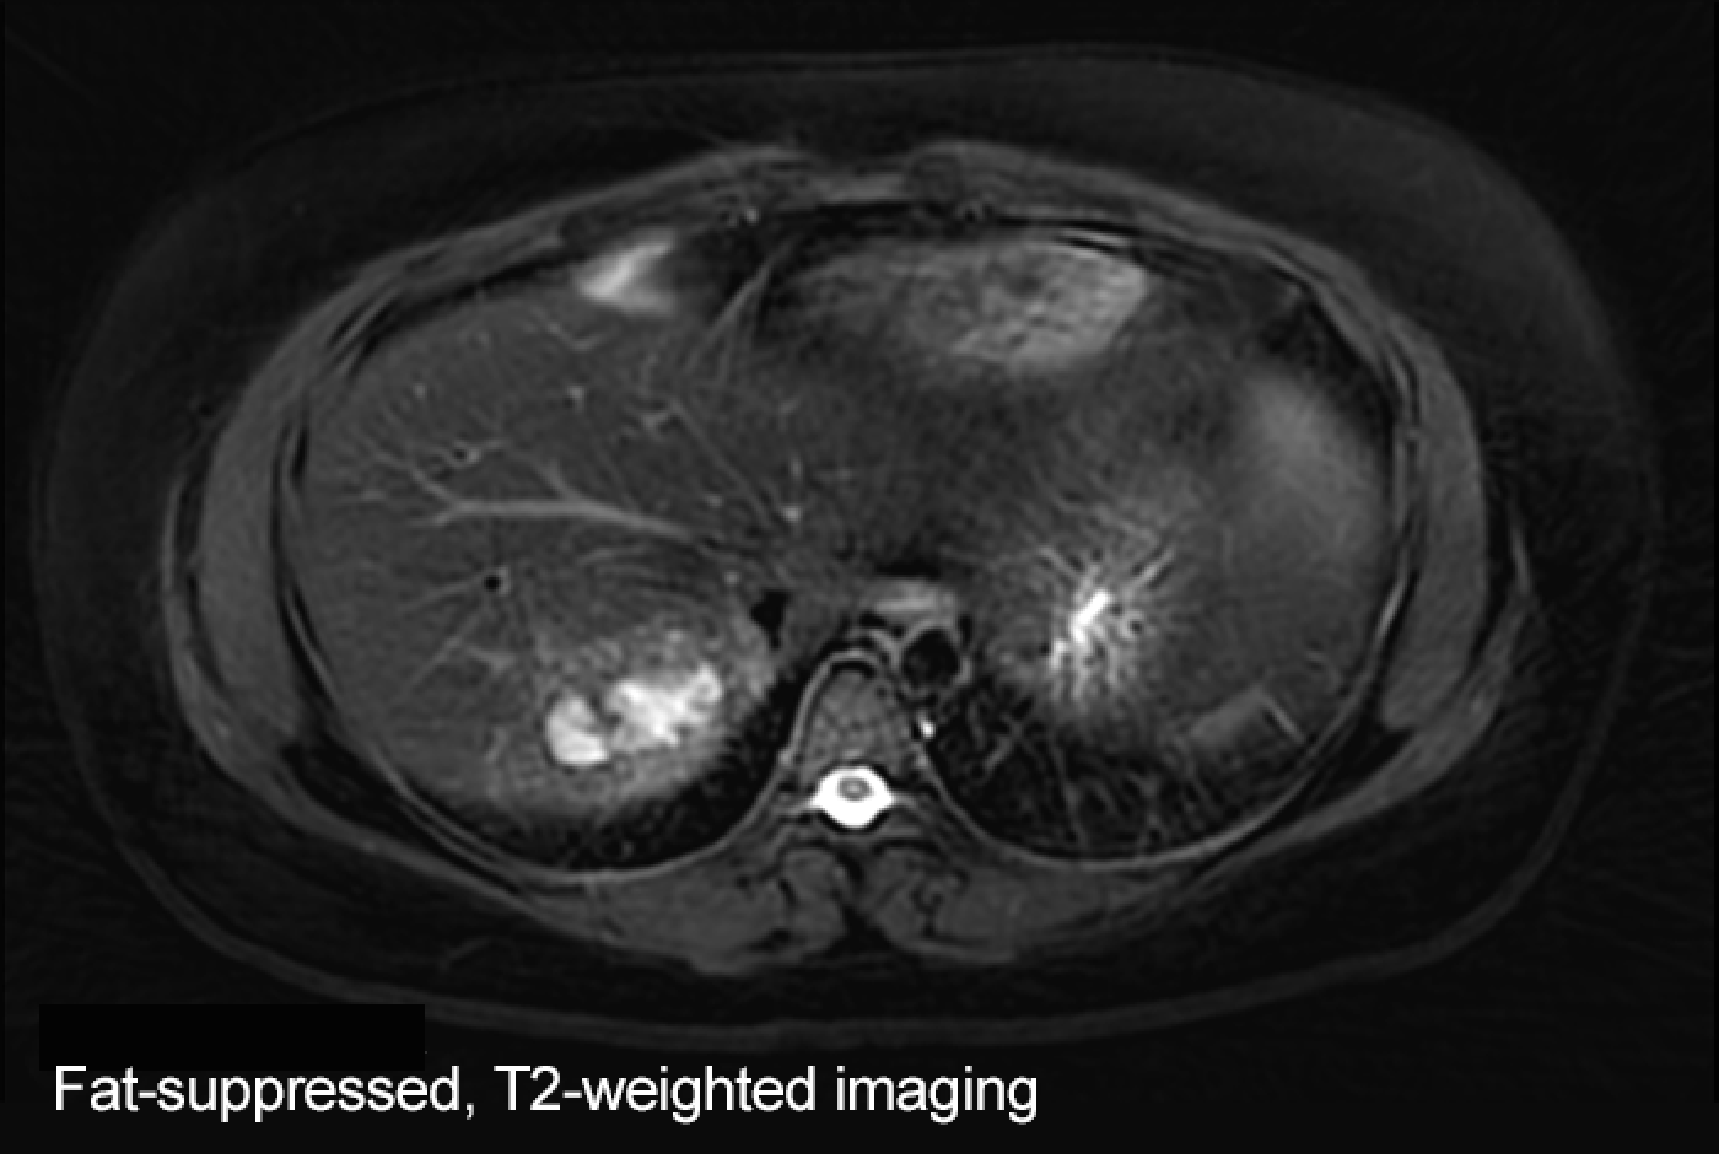
A heterogeneous high signal was seen in the tumor with both fat-suppressed, T1-weighted and fat-suppressed, T2-weighted imaging, which is considered to be a sign of intratumoral hemorrhage.
Fig. 2. MRI image, approximately 6 months after initial image
Photography protocol
| Imaging type | Photography sequence | Photography duration | TE (msec) | TR (msec) | FA (deg) | Fat sat (type) | ETL (number) | P-MRI (Reduction Factor) | Holding breath (yes/no) | NEX (calculation number) |
| Dual echo | 2D-GRE(Fast SPGR) | 21sec | 2.2 4.8 | 200 | 80 | ー | - | 2.0 | Yes | - |
| Contrast agent administration | ||||||||||
| Dynamic | 3D-GRE(LAVA) | 22sec | 1.8 | 4.1 | 12 | Chem SAT (Special) | - | 1.79 | Yes | - |
| DWI | SE EPI | 1min 30sec | Minimum (77.0msec) | 5000-8000 | 90 | - | - | 2.0 | No | 2 |
| T2WI | FSE | 24sec | 80 | 3000 | 90 | FAT | 16 | 1.75 | Yes | 1 |
| Hepatobiliary phase | 3D-GRE(LAVA) | 20sec | 1.7 | 3.6 | 12 | Chem SAT (Special) | - | 1.79 | Yes | - |
| Hepatobiliary phase Cor | 3D-GRE(LAVA) | 22sec | 1.7 | 3.6 | 12 | Chem SAT (Special) | - | 1.81 | Yes | - |
| Imaging type | k-space | In-plane resolution (mm) | Slice thickness (mm) | FOV (mm) | Rectangular FOV(%) | Phase direction (step number) | Read direction (matrix number) | Slice Gap (mm) | Slice number |
| Dual echo | sequential | 1.3×1.5 | 8.0 | 380 | 80 | 256 | 288 | 2 | 50 |
| Contrast agent administration | |||||||||
| Dynamic | sequential | 1.5×1.5 | 4.0 | 380 | 80 | 256 | 256 | ー | 50 (using ZIP) |
| DWI | sequential | 3.0×3.0 | 8.0 | 380 | 100 | 128 | 128 | 2.0 | 20 |
| T2WI | sequential | 1.0×1.5 | 8.0 | 380 | 70 | 224 | 288 | 2.0 | 20 |
| Hepatobiliary phase | sequential | 1.5×1.5 | 4.0 | 380 | 80 | 256 | 256 | ー | 50 (using ZIP) |
| Hepatobiliary phase Cor | sequential | 1.5×1.5 | 4.0 | 380 | 80 | 256 | 256 | ー | 50 (using ZIP) |
Devices used and contrast conditions
| MRI device | Signa HDxt |
| Automatic injection device | Sonic Shot |
| Workstation | ー |
| Contrast conditions | Dose (mL) | Administration rate (mL/s) | Photography timing | |
| Gadoxetate disodium(Gd-EOB-DTPA) | 0.1mL/kg | 10-s injection | Initiation when the contrast agent reached the left ventricle (approximately 30 s, approximately 70 s, and approximately 135 s) | |
| Physiological saline solution for flushing | 30mL | Same speed as contrast agent |
Usefulness of Gadoxetate disodium(Gd-EOB-DTPA) contrast MRI with this patient
Hepatocellular adenoma is a benign tumor with primary onset in the liver, and is comparatively rare in Japan. β-catenin-activated hepatocellular adenoma, a rare subtype, is closely associated with malignant transformation. β-catenin-activated hepatocellular adenoma has been reported to show maintained or increased OATP1B3 expression, and a high signal in the EOB-MRI hepatobiliary phase(1). In the 5th edition of the WHO classification, some changes had been made to the emphasis on presence or absence of β-catenin activation, and the role of EOB-MRI in subtype diagnosis of hepatocellular adenoma is considered to have become important. With this patient, EOB-MRI is considered to have been useful for identifying hepatocellular adenoma at high risk of becoming malignant.
- Fukusato T, Soejima Y, Kondo F, et al. Preserved or enhanced OATP1B3 expression in hepatocellular adenoma subtypes with nuclear accumulation of β-catenin. Hepatol Res. 2015 Oct;45(10):E32-42.
- *The case introduced is just one clinical case, so the results are not the same as for all cases.
- *Please refer to the Package Insert for the effects and indications, dosage and administration method, and warnings, contraindications, and other precautions with use.
