

Usefulness of EOB-MRI in the evaluation of HCC with bile duct invasion receiving proton beam radiotherapy.
Department of Medical Imaging and Intervention, Linkou Chang Gung Memorial Hospital. Taoyuan, Taiwan.
An-Hsin Chen
Department of Medical Imaging and Intervention, Linkou Chang Gung Memorial Hospital. Taoyuan, Taiwan.
Jeng-Hwei Tseng
Department of Medical Imaging and Intervention, Linkou Chang Gung Memorial Hospital. Taoyuan, Taiwan.
DATE : 2022
Patient characteristics

Patient’s background
64 years old, Male, 66kg
Disease(s): Post proton beam radiotherapy evaluation of HCC with bile duct invasion.
Patient characteristics and purpose of contrast-enhanced MRI
This patient is a 64 Y/O male with history of hepatitis-C related cirrhosis and HCC (T2N0M0, BCLC-C) S/P TACE and RFA, who visited the ER due to abdominal pain and jaundice. Contrast-enhanced CT revealed hemobilia with diffuse biliary tract dilatation. Following MRCP, the patient had shown suspicious recurrent HCC in S8 liver with bile duct invasion, which was thus proven by ERCP with CBD biopsy. Proton beam radiotherapy (PBT) was therefore applied rather than pursuing surgical treatment due to inadequate liver volume. Sequential EOB-MRIs were performed every 3 months in the 1-year follow-up after completing the 1-month-course of PBT.
Contrast agent used/ Dose
Gadoxetate disodium(Gd-EOB-DTPA) injection 0.1 ml/1kg (fix dose: 10 ml per patient)
Case description
Before receiving PBT, ERBD was placed for biliary decompression. During his 1-month PBT treatment, there was no major adverse events, except mild dermatitis over the RUQ radiation zone. The recurrence was well responded to PBT with recanalization of bile duct, and the ERBD was thus removed 2 years after treatment.
Images
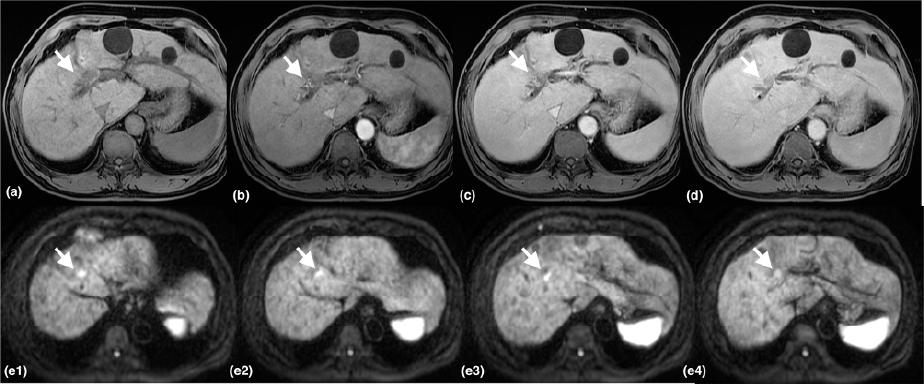
The S8 tumor recurrence with bile duct invasion (white arrows) demonstrates wash-out on delayed phase and restricted diffusion on DWI sequence.
- Figure 1. Pre-PBT MRI T1 post-contrast dynamic phase(a)(b)(c)(d), DWI(e1-e4)
(a) T1 pre-contrast, (b) T1 post-contrast arterial phase,
(c) T1 post-contrast venous phase, (d) T1 post-contrast delayed phase
(a) T1 pre-contrast, (b) T1 post-contrast arterial phase,
(c) T1 post-contrast venous phase, (d) T1 post-contrast delayed phase
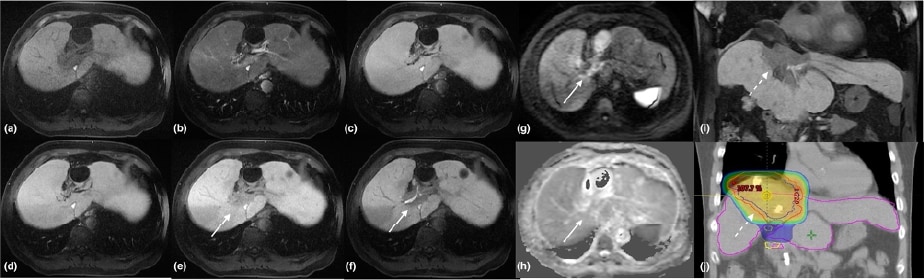
A clearly depicted hypointense area in S4/8 liver on hepatobiliary phase of EOB-MRI without restricted diffusion (white arrows); and the hypointense area on coronal had shown similar demarcation as the expected RT field (dashed arrows), suggesting “focal liver reaction” rather than tumor growth.
- Figure 2. EOB-MRI 1 year after PBT, post-contrast dynamic study
(a) T1 pre-contrast, (b) T1 post-contrast arterial phase (25s),
(c) T1 post-contrast venous phase, (d) T1 post-contrast 5 mins,
(e) T1 post-contrast 10 mins, (f) T1 post-contrast 20mins,
(g) high-b value DWI, (h) ADC,
(i) T1 post-contrast 20mins coronal view, (j) RT simulation
(a) T1 pre-contrast, (b) T1 post-contrast arterial phase (25s),
(c) T1 post-contrast venous phase, (d) T1 post-contrast 5 mins,
(e) T1 post-contrast 10 mins, (f) T1 post-contrast 20mins,
(g) high-b value DWI, (h) ADC,
(i) T1 post-contrast 20mins coronal view, (j) RT simulation
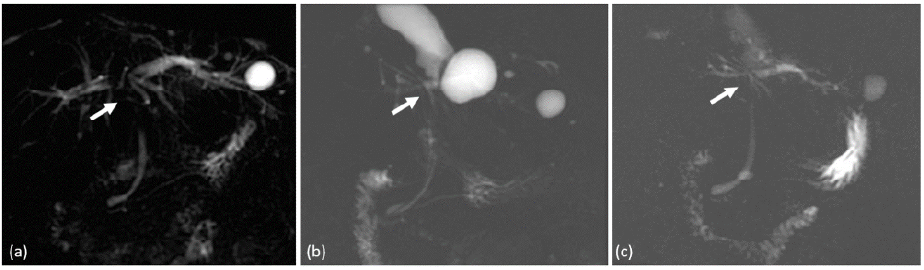
(a) Pre-treatment MRCP had shown tumor invasion with IHD confluence obstruction (arrowhead)
(b) (c) Post-PBT MRCP had shown recanalization of the bile duct.
Figure 3. MRCP (a) pre-PBT; (b) post-PBT 1 year; (c) post-PBT 2 year.
Usefulness of contrast-enhanced MRI with Gadoxetate disodium(Gd-EOB-DTPA) in this case
Despite complete response of the recurrent HCC, focal liver reaction (FLR) had been noted ever since his 1st follow-up EOB-MRI, which appeared with clearly depicted hypointense area on the hepatobiliary phase of EOB-MRI. Radiotherapy for liver tumors might develop radiation-induced liver disease, or so-called focal liver reaction. Areas with liver function loss could be clearly detected with hepatocyte-specific contrast agent-Gd-EOB-DTPA, which shows hypointense area surrounded by normal enhanced liver parenchyma. Such parenchymal enhancement on hepatobiliary phase of EOB-MRI could also predict the residual liver volume.
Imaging protocol
Devices used
| MR device used | GE Signa HDxt |
|---|---|
| Autoinjector | n/a |
| Workstation | AW VolumeShare 5 |
| Contrast enhancement condition | Dose(mL) | Infusion rate (mL/sec) | Imaging timing | |
|---|---|---|---|---|
| Gadoxetate disodium(Gd-EOB-DTPA) | 10 ml | 1 ml/s | 40 mins | |
| Physiological saline chaser | 10 ml | 1 ml/s |
| Imaging type | Imaging sequence | Imaging duration | TE (msec) |
TR (msec) |
TI (msec) |
FA (deg) |
Fat Sat (Type) |
ETL (Number) |
Breath hold (Present/Absent) |
NEX (Number of additions) |
Slice thickness (mm) |
FOV (mm) |
Rectan gular FOV (%) |
Lead direction (Number of matrices) |
Slice gap (mm) |
Number of slices |
|---|---|---|---|---|---|---|---|---|---|---|---|---|---|---|---|---|
| Dual echo | FSPGR | 19 sec | 2.1 | 130 | ー | 70 | n/a | 1 | present | 0.5 | 7.0 | 38 | 100 | 256x224 | 0 | 60 |
| With a contrast agent | ||||||||||||||||
| Dynamic | ー | ー | ー | ー | ー | ー | ー | ー | ー | ー | ー | ー | ー | ー | ー | ー |
| DWI | EPI | 3.0 min | 64.3 | 12000 | 0 | 90 | n/a | 1 | absent | 4.0 | 7.0 | 38 | 100 | 80x128 | 0 | 90 |
| T2WI | SSFSE | 20 sec | 91.7 | 650 | 0 | 90 | n/a | 1 | present | 0.58 | 7.0 | 38 | 100 | 320x192 | 0 | 30 |
| HBP (coronal) |
LAVA | 26 sec | 1.7 | 3.9 | 7 | 15 | special | 1 | present | 0.73 | 4.0 | 40 | 80 | 320x192 | 0 | 96 |
- *The case introduced is just one clinical case, so the results are not the same as for all cases.
- *Please refer to the Package Insert for the effects and indications, dosage and administration method, and warnings, contraindications, and other precautions with use.
