

Usefulness of Gadoxetate disodium(Gd-EOB-DTPA) contrast magnetic resonance imaging(EOB-MRI) for judging the therapeutic efficacy of tyrosine-kinase-inhibitors (TKIs) for hepatocellular carcinoma (HCC)
Sapporo Kosei General Hospital
Dr. Tomohiro Arakawa, Dept. of Gastroenterology (Hepatology)
Philips Ingenia
DATE : 2020
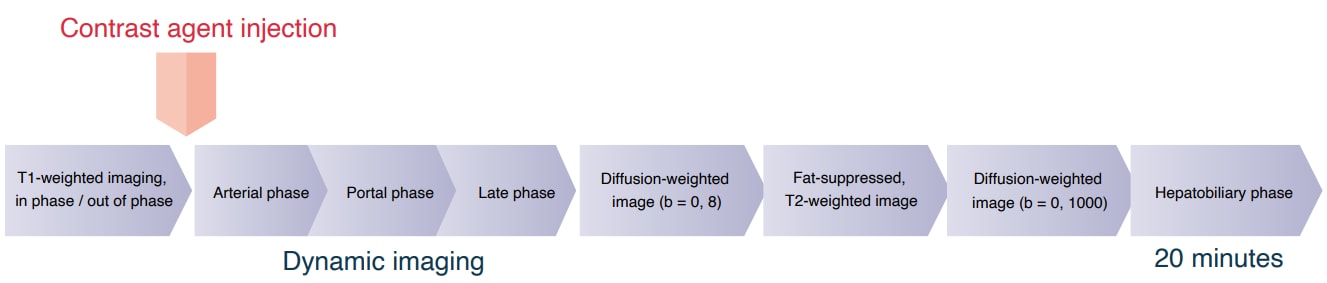
INJECTION METHOD DEVISED FOR EOB-MRI
High-speed Gadoxetate disodium(Gd-EOB-DTPA) injection can generate the Gibbs ringing artifact, so the injection speed used for imaging at the author’s hospital is 1.5 mL/s.
The injector has a Keep Vein Open (KVO) function, which enables routing problems to be prevented in advance, by ensuring the flow of physiological saline solution (saline) by drip infusion before and after imaging. In addition, the tubes used are spiral-shaped, and therefore do not become disconnected even if subjected to tension due to the table being moved, etc.
Imaging sequence
Devices used and imaging conditions
| Device used | MRI device | PHILIPS Ingenia 3.0T,Achieva 1.5T |
|---|---|---|
| Automatic injection device | MEDRAD Spectris Solaris EP | |
| Work station | SYNAPSE VINCENT |
| Contrast conditions | Dose | Administration rate (mL/s) | Image timing | |
|---|---|---|---|---|
| Gadoxetate disodium(Gd-EOB-DTPA) | 0.1mL/kg | 1.5mL/sec | In the arterial phase, timing is decided upon by bolus-tracking, and imaging is performed after 60, 90 and 180 s. | |
| Saline for flushing | 30mL | 1.5mL/sec |
Imaging parameters
| Imaging type | Imaging sequence | Imaging duration (s) | TE (ms) | TR (ms) | TI (ms) |
|---|---|---|---|---|---|
| T1-weighted imaging, in/out of phase | 2D-GRE Dual echo | 16.9s | 1.15/2.3 | 209 | ー |
| Bolus-tracking | Imaging initiated close to the aortic bifurcation region | ||||
| Dynamic study | 3D-GRE | 12.6s | 1.38 | 2.9 | ー |
| Diffusion-weighted imaging, b = 0, 8 (s/mm2) | SE-EPI | 18.0s | 60 | 2,998 | ー |
| Respiratory-synchronized, fat-suppressed, T2-weighted imaging | FSE | 1m15s (3 ~ 5min) | 80 | 3,510 Respiratory cycle | ー |
| Diffusion-weighted imaging, (b = 0, 1000 (s/mm2) | SE-EPI | 1m48s (3 ~ 5min) | 54 | 4,885 Respiratory cycle | ー |
| Hepatobiliary phase (20 min) | 3D-GRE | 12.6s | 1.38 | 2.9 | ー |
| Imaging type | FA (º) | Fat sat (type) | ETL (number) | P-MRI (reduction factor) | Holding breath |
|---|---|---|---|---|---|
| T1-weighted imaging, in/out of phase | 60 | ー | ー | 2 | Yes |
| Bolus-tracking | Imaging initiated close to the aortic bifurcation region | ||||
| Dynamic study | 11 | SPAIR | 35 | 2 | Yes |
| Diffusion-weighted imaging, b = 0, 8 (s/mm2) | 90 | SPIR | ー | 2.5 | Yes |
| Respiratory-synchronized, fat-suppressed, T2-weighted imaging | 90 | SPIR | 24 | 2 | No |
| Diffusion-weighted imaging, (b = 0, 1000 (s/mm2) | 90 | SPIR | ー | 2.5 | No |
| Hepatobiliary phase (20 min) | 11 | SPAIR | 35 | 2 | Yes |
| Imaging type | NEX(calculation number) | k-space | In-plane resolution (mm) | Slice thickness (mm) | FOV (mm) |
|---|---|---|---|---|---|
| T1-weighted imaging, in/out of phase | 1 | ー | 1.61 × 1.61 | 5 | 360 |
| Bolus-tracking | Imaging initiated close to the aortic bifurcation region | ||||
| Dynamic study | 1 | linear | 1.58 × 1.98 | 1.5 (3mm) | 360 |
| Diffusion-weighted imaging, b = 0, 8 (s/mm2) | 1 | ー | 2.05 × 2.07 | 5 | 360 |
| Respiratory-synchronized, fat-suppressed, T2-weighted imaging | 1 | linear | 1.13 × 1.50 | 5 | 360 |
| Diffusion-weighted imaging, (b = 0, 1000 (s/mm2) | 1 | ー | 3.21 × 3.29 | 5 | 360 |
| Hepatobiliary phase (20 min) | 1 | linear | 1.58 × 1.98 | 1.5 (3mm) | 360 |
| Imaging type | Rectangular FOV (%) | Read direction (matrix number) | At-speed scan (%) | Slice gap (mm) | Slice thickness (mm) | 3D over-sampling (%) |
|---|---|---|---|---|---|---|
| T1-weighted imaging, in/out of phase | 80 | 224 | 100 | 10% | 32 | ー |
| Bolus-tracking | Imaging initiated close to the aortic bifurcation region | |||||
| Dynamic study | 75 | 240 | 80 | ー | 140 | 115 |
| Diffusion-weighted imaging, b = 0, 8 (s/mm2) | 85 | 176 | 98.3 | 10% | 32 | ー |
| Respiratory-synchronized, fat-suppressed, T2-weighted imaging | 80 | 320 | 75 | 10% | 32 | ー |
| Diffusion-weighted imaging, (b = 0, 1000 (s/mm2) | 80 | 112 | 97.2 | 10% | 38 | ー |
| Hepatobiliary phase (20 min) | 75 | 240 | 80 | ー | 140 | 115 |
CASE PRESENTATION

Patient’s background and objectives of MRI
Male, 50s.
The patient had chronic hepatitis B as the primary disease, and developed portal vein tumor thrombosis (Vp3) and associated multiple HCC (Child-Pugh classification score: 6; maximum tumor diameter: 109 mm), which were treated with chemotherapy, involving injection into the hepatic artery by means of reservoir implantation, but the finding was then progressive disease.
Administration of 800 mg/day sorafenib was then initiated, but progressive disease was still found, so the treatment was switched to 160 mg/day regorafenib. Imaging then showed marked anti-tumor efficacy (complete response), but PIVKA-II was later found to increase again. It was difficult to identify the locus of recrudescence by contrast computed tomography (CT; Fig. 1C), so EOB-MRI was performed (Fig. 2).
Fig. 1. Contrast CT images, arterial phase
A: Before sorafenib administration. B: After sorafenib administration for 2 months, before regorafenib administration. C: After regorafenib administration for 5 months: Top: Approximately the same section as with EOB-MRI; bottom: section showing the maximum tumor contrast enhancement.
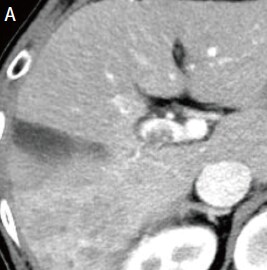
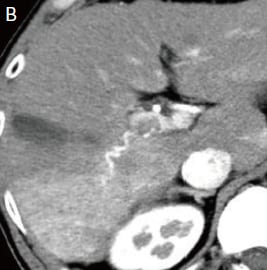
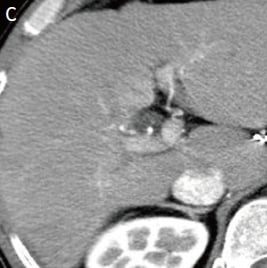
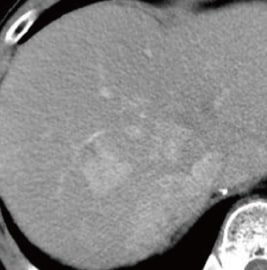
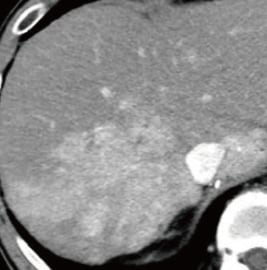
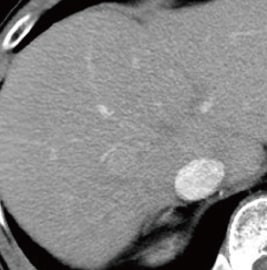
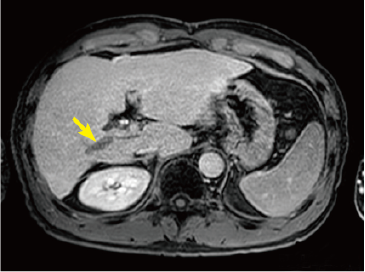
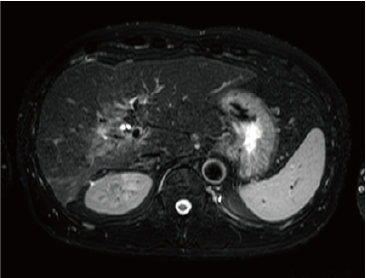
Fig. 2. EOB-MRI images
In the hepatobiliary phase, a distinct low signal was found in the posterior branch of the portal vein, and a high signal was found at the same locus with diffusion-weighted imaging, suggesting portal vein tumor thrombosis. Pre-contrast, T1-weighted imaging showed the posterior branch of the portal vein to have expanded, and the same locus showed faint staining in the arterial phase, and a low signal in the late phase. Even with T2-weighted imaging, the posterior branch of the portal vein showed a high signal, but identification of the tumor by imaging alone was difficult.
Hepatobiliary phase
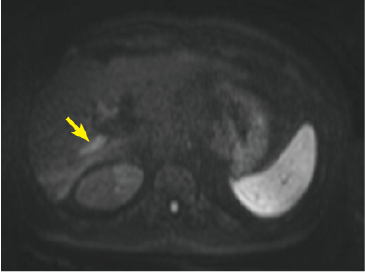
Diffusion-weighted image
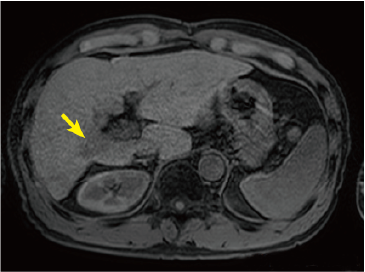
Pre-contrast T1-weighted image
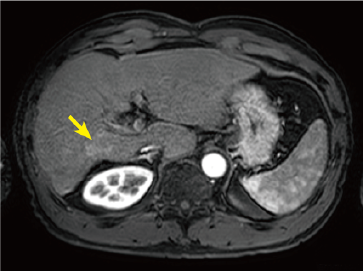
Arterial phase
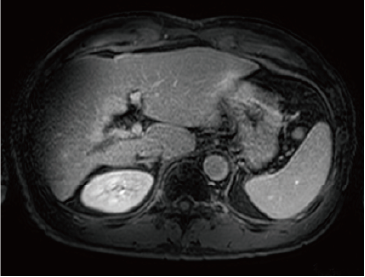
Late phase
T2-weighted image
USEFULNESS OF EOB-MRI WITH THIS PATIENT
When administering TKIs, which are agents that inhibit angiogenesis, the standard procedure is to perform m-RECIST, which determines anti-tumor efficacy by measuring blood flow. In general, in the case of nodules that show marked decrease in arterial blood flow with TKI administration, recognition in the contrast CT arterial phase is difficult, but it is rare for the tumor to be eliminated. It is therefore essential for the tumor size to be determined in the venous phase, but tumor margins are often indistinct.
With the present patient, regorafenib administration not only reduced arterial blood flow to the tumor, but also resulted in marked contraction of the tumor, and tumor-marker normalization. The tumor-markers later increased again, and liver cancer recrudescence was suspected, but no locus of recrudescence could be identified by CT. Finally, portal vein tumor thrombosis, which is particularly difficult to evaluate by CT, could be recognized distinctly in the EOB-MRI hepatobiliary phase, and diffusion-weighted imaging strongly supported recrudescence at the same locus.
To date, contrast CT has been used for evaluative imaging during TKI treatment with numerous patients.
With EOB-MRI, artifacts sometimes make evaluation during the arterial phase difficult, but with the present patient tumor contrast enhancement in the arterial phase was also more favorable than with contrast CT. EOB-MRI, which combines hemodynamic evaluation and hepatocyte function evaluation, is characterized by high effectiveness of abnormal hepatocyte detection in the hepatobiliary phase, and enables evaluation from perspectives other than hemodynamic evaluation. It is considered to be an ideal imaging method for identifying micro-nodules with reduced blood flow to tumors due to TKI administration, and ascertaining changes in their sizes.
- *The case introduced is just one clinical case, so the results are not the same as for all cases.
- *Please refer to the Package Insert for the effects and indications, dosage and administration method, and warnings, contraindications, and other precautions with use.
