

EOB-MRI used for colorectal cancer diagnosis and staging
MI Clinic
Dr. Seiki Hamada, Hospital Director, Dept. of Radiology
Dr. Risa Momoi, Deputy Chief Radiology Technologist, Dept. of Clinical Technology
GE
SignaHD
DATE : 2020
INJECTION METHODS DEVISED FOR EOB-MRI
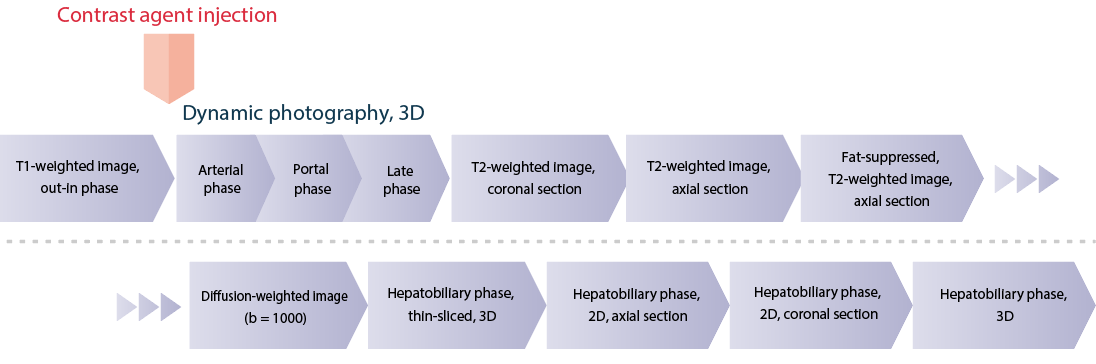
Various photography methods are in use in the arterial phase of dynamic contrast imaging, but at the authors’ hospital the timing is fixed at 25, 70 and 180 s. In the case of elderly patients and patients who have been treated with transarterial chemoembolization, etc., the timing with this method has sometimes deviated a little from the optimal timing for the arterial phase.
On July 1, 2019, the injection speed for contrast agents and physiological saline solution (saline) was reduced from 2.0 to 1.5 mL/s, and the volume of saline for flushing was increased from 30 to 40 mL. Since that change, there have been no more cases of the timing being too early or too late, so as to be unsuitable for the arterial phase, and at the authors’ hospital this technique, which is simple to use, has continued in use, and has been accepted as standard.
Photography sequence
Devices used and photography conditions
| Device used | MRI device | SignaHD 1.5T(Ver.23) |
|---|---|---|
| Automatic injection device | MEDRAD Spectris Solaris EP |
| Contrast conditions |
Dose | Administration rate (mL/s) |
Photography timing | |
|---|---|---|---|---|
| Gadoxetate disodium(Gd-EOB-DTPA) | 0.1mL/kg | 1.5mL/sec | Mask/25/70/180(sec) | |
| saline for flushing | 40mL | 1.5mL/sec |
Photography parameters
| Imaging type | Photography sequence | Photography duration | TE (ms) | TR (ms) | TI (ms) |
|---|---|---|---|---|---|
| T1WI Axi(out-in phase) | 2D-GRE (Fast SPGR) | 16-20 s | 2.1/4.3 | 175 | ー |
| Dynamic study(3D) | 3D-GRE (LAVA) | 16-20 s | 2.0 | 4.3 | 14 |
| T2WI coronal | Fast SE (SSFSE) | 16-20 s | Approx. 90 | Approx. 740 | ー |
| T2WI axial | Fast SE (SSFSE) | 16-20 s | Approx. 90 | Approx. 740 | ー |
| T2WI axial, fat-suppressed | Fast SE (SSFSE) | 16-20 s | Approx. 90 | Approx. 740 | ー |
| Diffusion-weighted image (b = 1000 s/mm2) | EPI | Approx. 2 min | Minimum (Approx. 76) | Approx. 6000 | ー |
| Thin-sliced, hepatobiliary phase, 3D | 3D-GRE (LAVA) | 22 s | 3.7 | 1.7 | 7 |
| Hepatobiliary phase, axial, out-in phase | 2D-GRE (Fast SPGR) | 16-20 s | 2.1/4.3 | 175 | ー |
| Hepatobiliary phase, coronal, out-in phase | 2D-GRE (Fast SPGR) | 16-20 s | 2.1/4.3 | 175 | ー |
| Hepatobiliary phase, 3D | 3D-GRE (LAVA) | 16-20 s | 2.0 | 4.3 | 7 |
| Imaging type | FA (º) | Fat sat (type) | P-MRI (reduction factor) | Holding breath | NEX (calculation number) |
|---|---|---|---|---|---|
| T1WI Axi(out-in phase) | 70 | ー | × 2 | 〇 | 1 |
| Dynamic study(3D) | 12 | 〇 (SPECIAL) | × 2 | 〇 | 0.7 |
| T2WI Cor | 90 | ー | × 2 | 〇 | 0.57 |
| T2WI Axi | 90 | ー | × 2 | 〇 | 0.57 |
| T2WI axial, fat-suppressed | 90 | 〇 (CHESS) | × 2 | 〇 | 0.57 |
| Diffusion-weighted image (b = 1000 s/mm2 ) | 90 | ー | × 2 | ー | 6 |
| Thin-sliced, hepatobiliary phase, 3D | 12 | 〇 (SPECIAL) | × 2 | 〇 | 0.73 |
| Hepatobiliary phase, axial, out-in phase | 70 | ー | × 2 | 〇 | 1 |
| Hepatobiliary phase, coronal, out-in phase | 70 | ー | × 2 | 〇 | 1 |
| Hepatobiliary phase, 3D | 12 | 〇 (SPECIAL) | × 2 | 〇 | 0.7 |
| Imaging type | k-space | In-plane resolution (mm) | Slice thickness (mm) |
FOV (mm) | Rectangular FOV (%) |
|---|---|---|---|---|---|
| T1WI Axi(out-in phase) | Linear | 1.88 × 1.13 - 2.08 × 1.25 | 6 - 8 | 36 - 40 | 100 |
| Dynamic study(3D) | Linear | 1.88 × 1.13 - 2.08 × 1.25 | 5.0 (2.5) |
36 - 40 | 100 |
| T2WI coronal | Linear | 1.61 × 1.41 - 1.79 × 1.56 | 6 - 8 | 36 - 40 | 100 |
| T2WI axial | Linear | 1.61 × 1.41 - 1.79 × 1.56 | 6 - 8 | 36 - 40 | 100 |
| T2WI axial, fat-suppressed | Linear | 1.61 × 1.41 - 1.79 × 1.56 | 6 - 8 | 36 - 40 | 100 |
| Diffusion-weighted image (b = 1000 s/mm2) |
Linear | 2.81 × 1.88 - 3.12 × 2.08 | 6 - 8 | 36 - 40 | 100 |
| Thin-sliced, hepatobiliary phase, 3D | Linear | 1.68 × 1.41 - 1.86 × 1.56 | 3.0 (1.5) |
36 - 40 | 80 |
| Hepatobiliary phase, axial, out-in phase | Linear | 1.88 × 1.13 - 2.08 × 1.25 | 6 - 8 | 36 - 40 | 100 |
| Hepatobiliary phase, coronal, out-in phase | Linear | 1.88 × 1.13 - 2.08 × 1.25 | 6 - 8 | 36 - 40 | 100 |
| Hepatobiliary phase, 3D | Linear | 1.88 × 1.13 - 2.08 × 1.25 | 5.0 (2.5) |
36 - 40 | 100 |
| Imaging type | Phase direction (step number) |
Read direction (matrix number) |
Slice gap (mm) |
Slice number | 3D partition number |
|---|---|---|---|---|---|
| T1WI Axi(out-in phase) | 192 | 320 | 1.5 - 2 | 24 | ー |
| Dynamic study(3D) | 192 | 320 | - 2.5 | 24 | 336 |
| T2WI coronal | 224 | 256 | 1.5 - 2 | 24 | ー |
| T2WI axial | 224 | 256 | 1.5 - 2 | 24 | ー |
| T2WI axial, fat-suppressed | 224 | 256 | 1.5 - 2 | 24 | ー |
| Diffusion-weighted image (b = 1000 s/mm2 ) |
128 | 192 | 1.5 - 2 | 24 | ー |
| Thin-sliced, hepatobiliary phase, 3D | 192 | 256 | - 1.5 | 70 | 140 |
| Hepatobiliary phase, axial, out-in phase | 192 | 320 | 1.5 - 2 | 24 | ー |
| Hepatobiliary phase, coronal, out-in phase | 192 | 320 | 1.5 - 2 | 24 | ー |
| Hepatobiliary phase, 3D | 192 | 320 | - 1.5 | 42 | 84 |
CASE PRESENTATION

Patient’s background and objectives of magnetic resonance imaging (MRI)
Male, 70s
Fecal occult blood was found, and colorectal endoscopy showed a malignant mass in the rectum.
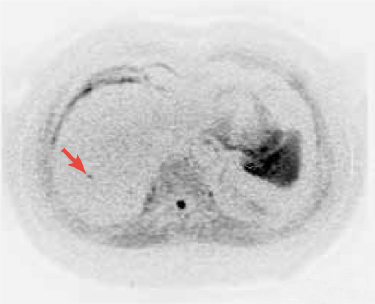
PET-CT was performed for diagnosis and staging, and a protruding lesion with a basal diameter of 40 mm was found in the rectum (Rb), with significant fluorodeoxyglucose (FDG) accumulation (SUVmax : 5.54; Fig. 1A). In addition, punctate FDG accumulation was found in S4 and S5 of the hepatic right lobe (Figs. 1A to 1C), and the presence of multiple hepatic metastases was suspected. To make a reliable diagnosis of hepatic metastasis, EOB-MRI was selected.
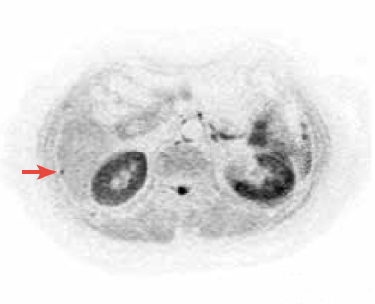
Fig. 1. PET-CT images
A) Maximum-intensity projection image with whole-body positron emission tomography (PET) performed for pre-treatment diagnosis and staging: FDG accumulation at the rectal primary lesion and two hepatic loci.
B, C) Fusion image: Punctate FDG accumulation in S4 (B) and S5 (C) of the hepatic right lobe, suggesting hepatic metastases.
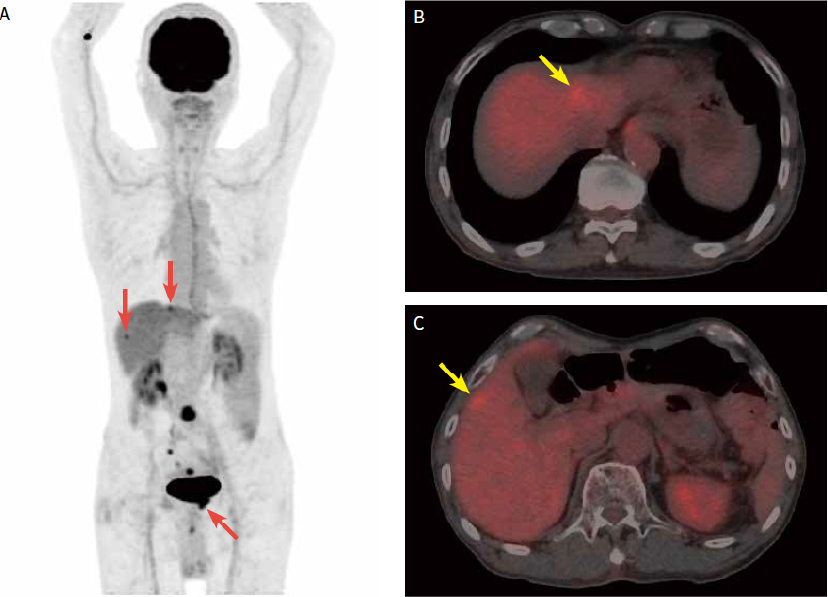
Fig. 2. EOB-MRI images
The metastases in S4 and S5 of the hepatic right lobe detected with PET-CT were also detected in the hepatobiliary phase of EOB-MRI, and the nodule in S5 showed ring-shaped contrast enhancement in the arterial phase. In addition, a new small nodule, no more than 5 mm in diameter, and showing reduced EOB uptake, was found in the dorsal region.
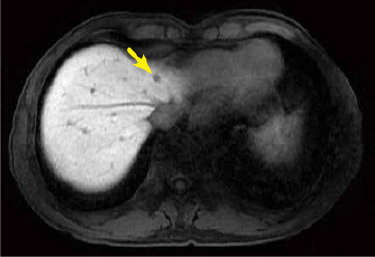
Hepatobiliary phase
Hepatobiliary phase
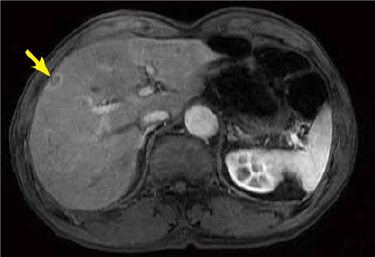
Arterial phase
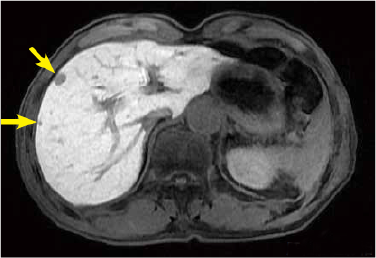
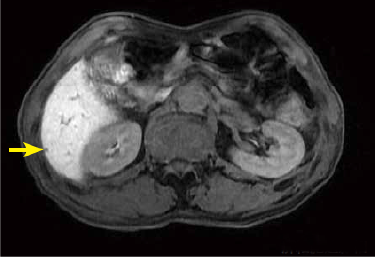
Fig. 3. EOB-MRI images
Two metastases less than 5 mm in diameter that could not be detected by PET-CT were found in S6 of the hepatic right lobe in the hepatobiliary phase of EOB-MRI. This nodule showed decreased diffusion in diffusion-weighted imaging.
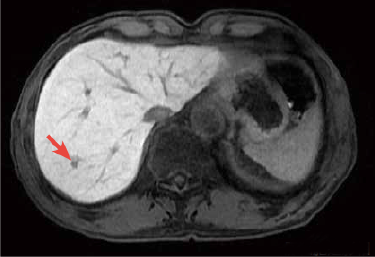
Hepatobiliary phase
Hepatobiliary phase
Diffusion-weighted image
(black-white inverted image)
Diffusion-weighted image
(black-white inverted image)
USEFULNESS OF EOB-MRI WITH THIS PATIENT
PET-CT is highly useful for diagnosis and staging of colorectal tumors, and is used for pre-treatment assessment of colorectal cancer, lung cancer, etc. However, in terms of spatial resolution, it does not readily generate images of lesions less than 5 mm in diameter. With the present patient, hepatic metastases 5 mm or more in diameter were detected by PET-CT, but it was difficult to diagnose hepatic nodules below that size. However, with EOB-MRI the existence of lesions up to 5 mm in diameter could be demonstrated, and the treatment was switched to a preoperative chemotherapy regimen.
In the 2016 edition of Diagnostic Imaging Guidelines edited by the Japan Radiological Society, the only imaging technique recommended for diagnosis of hepatic metastases is EOB-MRI, and it has a grade-A recommendation1). EOB-MRI enables detection of even small metastatic hepatic tumors that cannot readily be detected with contrast CT. In order to detect and evaluate small lesions, it is considered that, if hepatic metastases are detected by PET-CT, EOB-MRI should also be performed, and the authors consider that this will make a significant contribution to treatment methods.
REFERENCES
1) Japan Radiological Society (ed.): Diagnostic Imaging Guidelines, 2016, Kanehara Shuppan, Tokyo, 2016
Precautions relating to administration
4. Administration to elderly patients
Elderly patients generally show depressed physiological function, and administration must be performed with care, and with sufficient monitoring of the patient’s condition.
- *The case introduced is just one clinical case, so the results are not the same as for all cases.
- *Please refer to the Package Insert for the effects and indications, dosage and administration method, and warnings, contraindications, and other precautions with use.
