

Usefulness of EOB-MRI for focal nodular hyperplasia (FNH) diagnosis
Aichi Cancer Center Hospital
Drs. Shohei Chatani and Yoshitaka Inaba, IVR Division, Dept. of Diagnostic and Interventional Radiology
GE SIGNA Architect 3.0T
DATE : 2021
INTRODUCTION
Patient’s background
Female; 70s; body weight: 48 kg; FNH
Investigation objectives
There was no particular primary complaint. Abnormalities were found by abdominal ultrasonography during a health check-up, and the patient was referred to the authors’ hospital.
Contrast computed tomography was performed at the authors’ hospital, and a mass was found in S8 of the liver, so EOB-MRI was performed as a thorough examination.
Contrast agent used
Gadoxetate disodium(Gd-EOB-DTPA) injection, 0.1 mL/kg
CASE EXPLANATION
A mass approximately 20 mm in diameter, showing early dark staining, was found by contrast computed tomography in S8 of the liver (Fig. 1). No clear wash-out was found in the portal and equilibrium phases, and the contrast enhancement was approximately the same as in the surrounding hepatic parenchyma (Fig. 2). With EOB-MRI, there was early dark staining in the arterial phase, and signs at the lower margin of the mass suggested early venous return (Figs. 3, 4). In the hepatobiliary phase, the mass showed ring-like enhancement (i.e. a high signal in a ring shape), and inside the ring the signal was similar to or lower than in the surrounding hepatic parenchyma (Figs. 5, 6). On the basis of these findings, a diagnosis of FNH was made. The patient was then monitored by imaging for several years, showing no marked changes.
IMAGING SIGNS
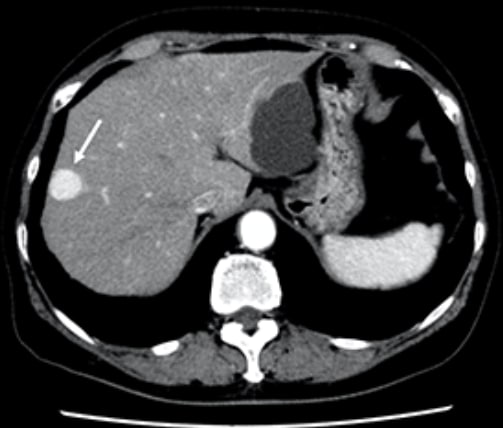
Fig. 1. Arterial phase of contrast computed tomography
A mass approximately 20 mm in diameter, with a distinct margin and intense contrast enhancement, was found in S8 of the liver (arrow).
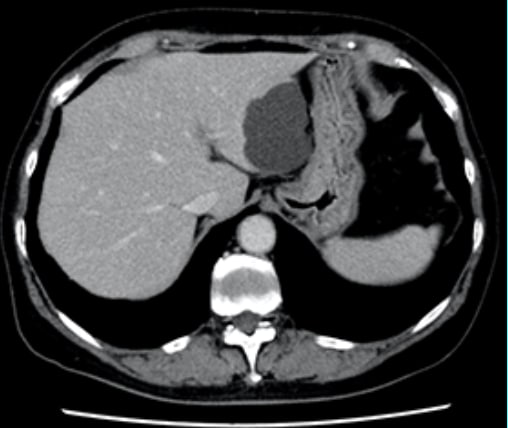
Fig. 2. Equilibrium phase of contrast computed tomography
The mass in S8 of the liver had become indistinct, showing approximately the same contrast enhancement as the surrounding hepatic parenchyma.
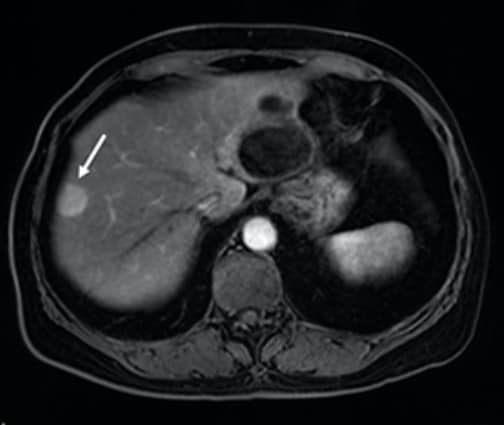
Fig. 3. Arterial phase of EOB-MRI
The mass in S8 of the liver showed intense contrast enhancement (arrow).
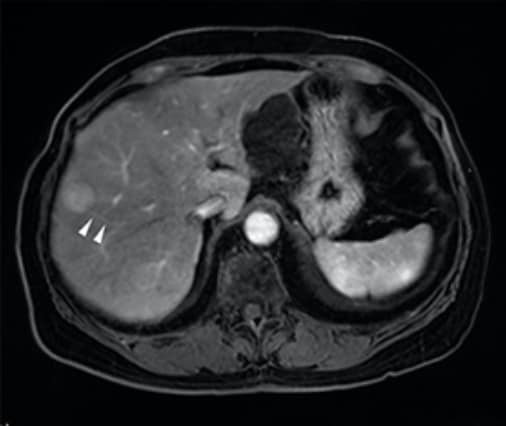
Fig. 4. Arterial phase of EOB-MRI
The findings suggested early venous return from the lower marginal region of the mass (arrowhead).
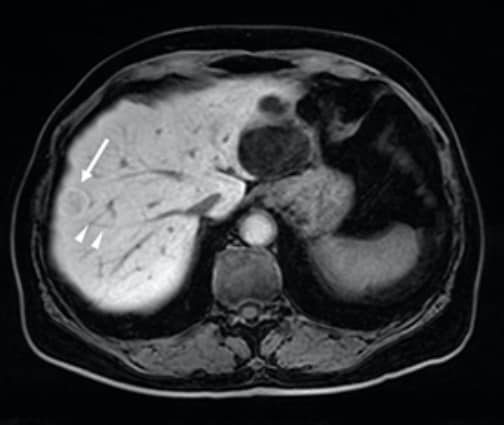
Fig. 5. Hepatobiliary phase of EOB-MRI
The mass shows ring-like enhancement (arrow). The arrowheads indicate the hepatic vein shown in Fig. 4.
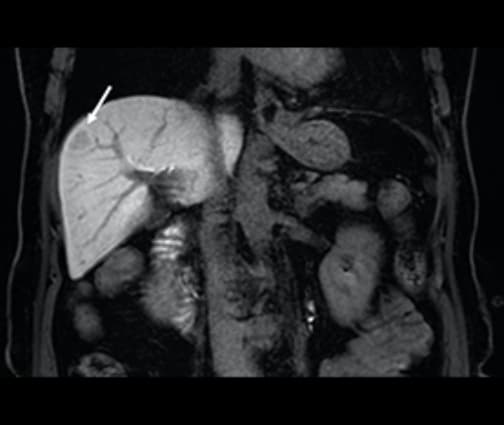
Fig. 6. Coronal section in hepatobiliary phase of EOB-MRI
The mass shows ring-like enhancement (arrow).
PHOTOGRAPHY PROTOCOL
| Imaging type | Photo-graphy sequence |
Photo-graphy dura-tion (s) |
TE (ms) | TR (ms) | TI (ms) | FA (º) | Fat sat (type) |
Holding breath |
|---|---|---|---|---|---|---|---|---|
| Dual echo | ||||||||
| Contrast agent admin-istration |
||||||||
| Dynamic | LAVA-FLEX | 18 | 1.7 | 5.3 | 0 | 12 | DIXON | Yes |
| DWI | DWI Prep | --- | 76 | 4000 | 110 | 90 | Chen-SAT | No |
| T2WI | SSFSE | 19 | 87.2 | 646 | 0 | 90 | --- | Yes |
| HBP | LAVA-FLEX | 18 | 1.7 | 5.3 | 0 | 12 | DIXON | Yes |
| Imaging type | NEX (calcula-tion number) |
In-plane resolu-tion (mm) |
Slice thick-ness (mm) |
FOV (mm) |
Phase direction (step number) |
Read direction (matrix number) |
Slice gap (mm) |
Slice number |
|---|---|---|---|---|---|---|---|---|
| Dual echo | ||||||||
| Contrast agent admin-istration |
||||||||
| Dynamic | 0.69 | 1.2×1.2 | 3.8 | 36 | 300 | 300 | 0 | 40 |
| DWI | 4 | 2.9×2.5 | 5 | 38 | 160 | 140 | 2 | 30 |
| T2WI | 0.58 | 1.0×1.1 | 5 | 36 | 320 | 352 | 2 | 30 |
| HBP | 0.69 | 1.2×1.2 | 3.8 | 36 | 300 | 300 | 0 | 40 |
Devices used and contrast conditions
| MRI device | SIGNA Architect 3.0T |
|---|---|
| Automatic injection device | Sonic Shot 7 |
| Work station | --- |
| Contrast conditions |
Dose (mL) | Administration rate (mL/s) |
Photographytiming | |
|---|---|---|---|---|
| Gadoxetate disodium(Gd-EOB-DTPA) | 4.8 | 1.0 | Dynamic, 3 phases (after 40, 90 and 180 s, and 20 min) |
|
| Physiological saline solution to flush |
40 | 1.0 |
USEFULNESS OF GADOXETATE DISODIUM(GD-EOB-DTPA) CONTRAST MRI WITH THIS PATIENT
FNH consists of reactive hepatocellular hyperplastic changes, involving formation of masses in response to localized hemodynamic abnormalities, and the lesions are not true tumors. The characteristic pathological sign is a fibrous central stellate scar, but this is sometimes not seen if the lesions are small. With EOB-MRI, the entire mass shows intense dark staining in the arterial phase, and the lesion together with the central scar sometimes shows a spoked-wheel pattern, with the nutrient arteries radiating in alignment with the fibrous septal region. In addition, early venous return is sometimes seen in the arterial phase, indicating hepatic venous emptying. Some cases show ring-like enhancement in the hepatobiliary phase, which is characteristic of FNH. With the present patient, the FNH diagnosis was reached on the basis of characteristic signs with EOB-MRI.
9. Precautions relating to patients with specific background factors (taken from the Package Insert)
9.8 Elderly patients
Administration must be performed with care, and with sufficient monitoring of the patient’s condition. Elderly patients generally have depressed physiological function.
- *The case introduced is just one clinical case, so the results are not the same as for all cases.
- *Please refer to the Package Insert for the effects and indications, dosage and administration method, and warnings, contraindications, and other precautions with use.
